OpenEO: a GDAL for Earth Observation Analytics
Earth observation data, or satellite imagery, is one of the richest sources to find out how our Earth is changing. The amount of Earth observation data we collect Today has become too large to analyze on a single computer. Although most of the Earth observation data is available for free, practical difficulties we are currently facing when we try to analyze it seriously constrains the potential benefits for citizens, industry, scientists, or society. How did we get here?
GIS: the 80’s
To understand the current difficulty when analyzing big Earth observation data analysis, let us look how geographic information systems (GIS) developed over the past decades. In the early days, they would be isolated structures:
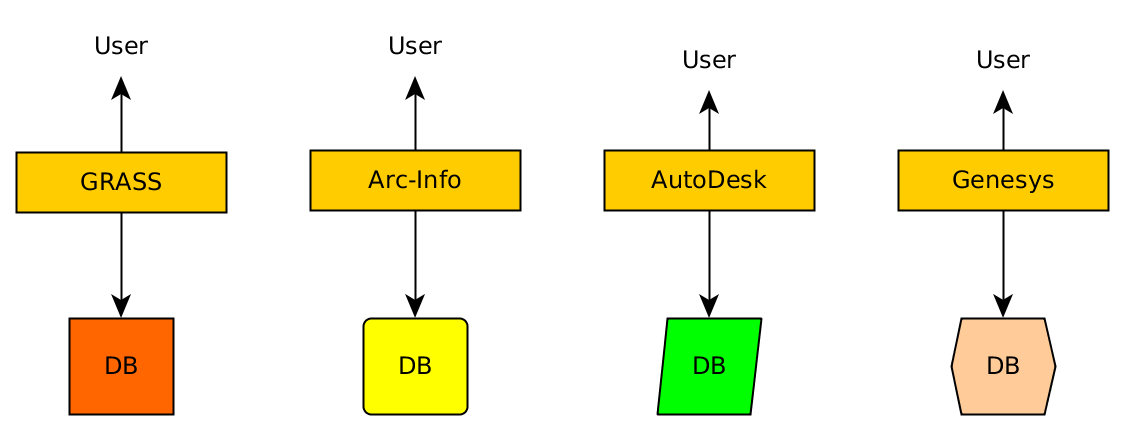
where one would get things done in isolation, without any chance of verifying or comparing it with another system: these were expensive systems, hard to set up and maintain, and (with the exception of GRASS) closed databases and closed source software.
File formats: the 90’s
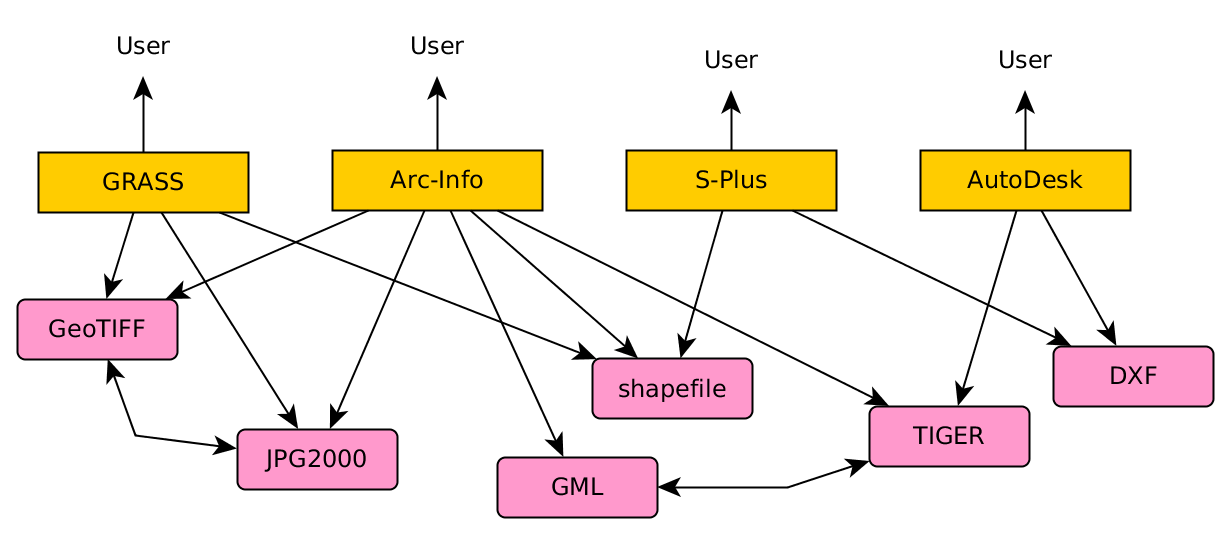
In the 90’s, file formats came up: several systems started supporting various file formats, and dedicated programs that would do certain file format conversions became available. This made many new things possible, such as the integration of S-Plus with Arc-Info, but to fully realize this, each software would have to implement drivers for every file format. Developing new applications or introducing a new file format are both difficult in this model.
GDAL: the 00’s
Then came GDAL! This Geospatial Data Abstraction Layer is a software library that reads and writes raster and vector data. Instead of having to write drivers for each file format, application developers needed to only write a GDAL client driver. When proposing a new file format, instead of having to convince many application developers to support it, only a GDAL driver for the new format was required to realize quick adoption. Instead of many-to-many links, only many-to-one links were needed:
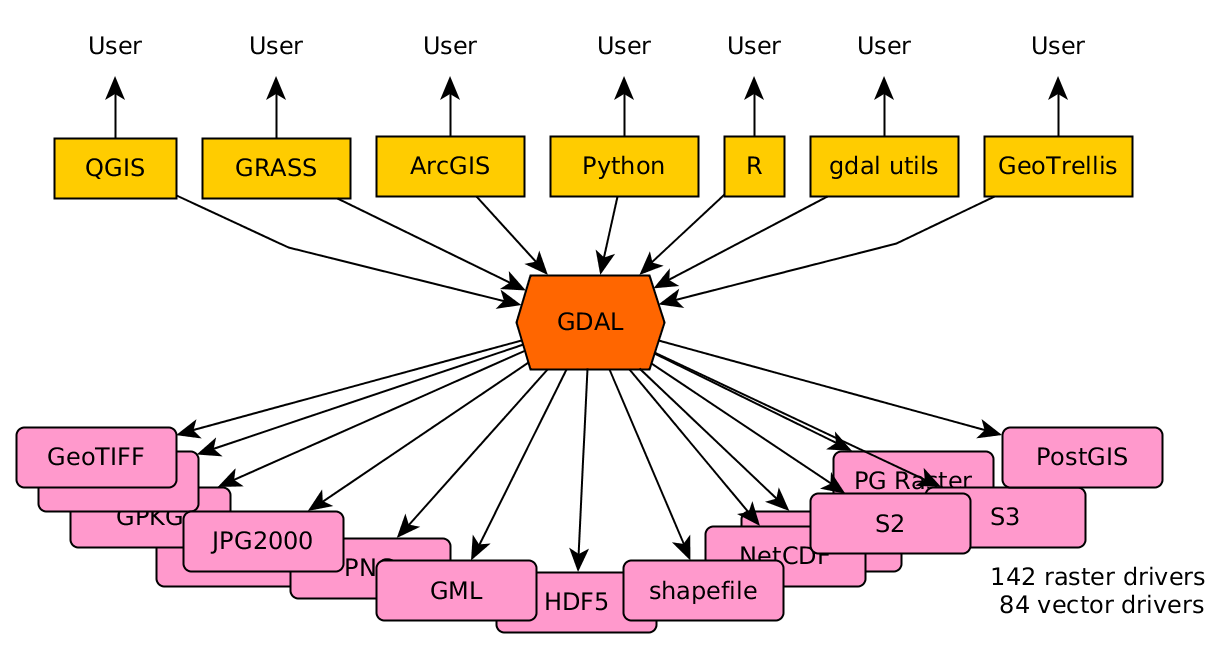
R and python suddenly became strong GIS and spatial modelling tools. ArcGIS users could suddenly deal with the weird data formats from hydrologists, meteorologists, and climate scientists. Developing innovative applications and introducing new file formats became attractive.
For analyzing big Earth observation data, GDAL has its limitations, including:
- it has weak data semantics: the data model does not include observation time or band wavelength (color), but addresses bands by dataset name and band number,
- raster datasets cannot tell whether pixels refer to points, cells with constant value, or cells with an aggregated value; most regridding methods silently assume the least likely option (points),
- the library cannot do much processing, meaning that clients that do the processing and use GDAL for reading and writing need to be close to where the data is, which is far away from the user’s computer.
Big Earth Observation data: the 10’s
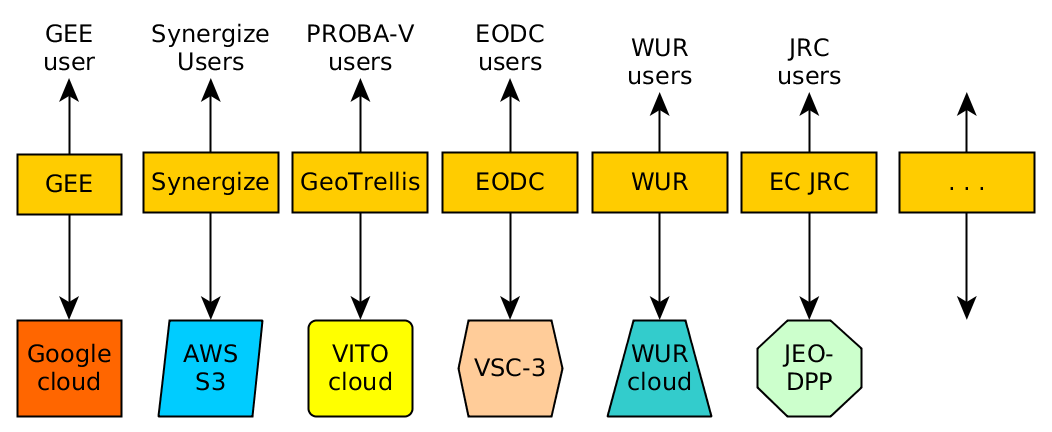
We currently see a plethora of cloud environments that all try to solve the problem of how to effectively analyze Earth Observation data that are too large to download and process locally. It very much reminds of the isolated GIS of the 80’s, in the sense that strongly differing systems have been built with large efforts, and when solving a certain problem in one system it is practically impossible to try to solve it in another system too. Several systems work with data processing back-ends that are not open source. The following figure only shows a few systems for illustration:
Open Earth Observation Science
For open science, open data is a necessary but not sufficient condition. In order to fight the reproducibility crisis, analysis procedures need to be fully transparent and reproducible. To get there, it needs to be simple to execute a given analysis on two different data centers to verify that they yield identical results. Today, this sounds rather utopian. On the other hand, we believe that one of the reasons that data science has taken off is that the software making it possible (e.g. python, R, spark) was able to hide irrelevant details and had reached at a stage where it was transparent, stable, and robust.
Google Earth Engine is an excellent example of an interface that is simple, in the sense that users can directly address sensors and observation times and work with composites rather than having to comb through the raw data consisting of large collections of files (“scenes”). The computational back-end however is not transparent, it lets the user execute functions as far as they are provided by the API, but not inspect the source code of these function, or modify them.
How then can we make progress out of a world of currently incompatible, isolated Earth Observation data center efforts? Learning from the past, the solution might be a central interface between users who are allowed to think in high-level objects (“Landsat 7 over Western Europe, 2005-2015”) and a set of computational Earth Observation data centers that agree on supporting this interface. A GDAL for Earth Observation Analytics, so to speak. We’ll call it OpenEO.
Open EO Interface: the 20’s
The following figure shows schematically how this could look like: Users write scripts in a neutral language that addresses the data and operations, but ignores the computer architecture of the back-end. The back-end carries out the computations and returns results. It needs to be able to identify users (e.g. verify its permission to use it), but also to tell which data they provide and which computational operations they afford.
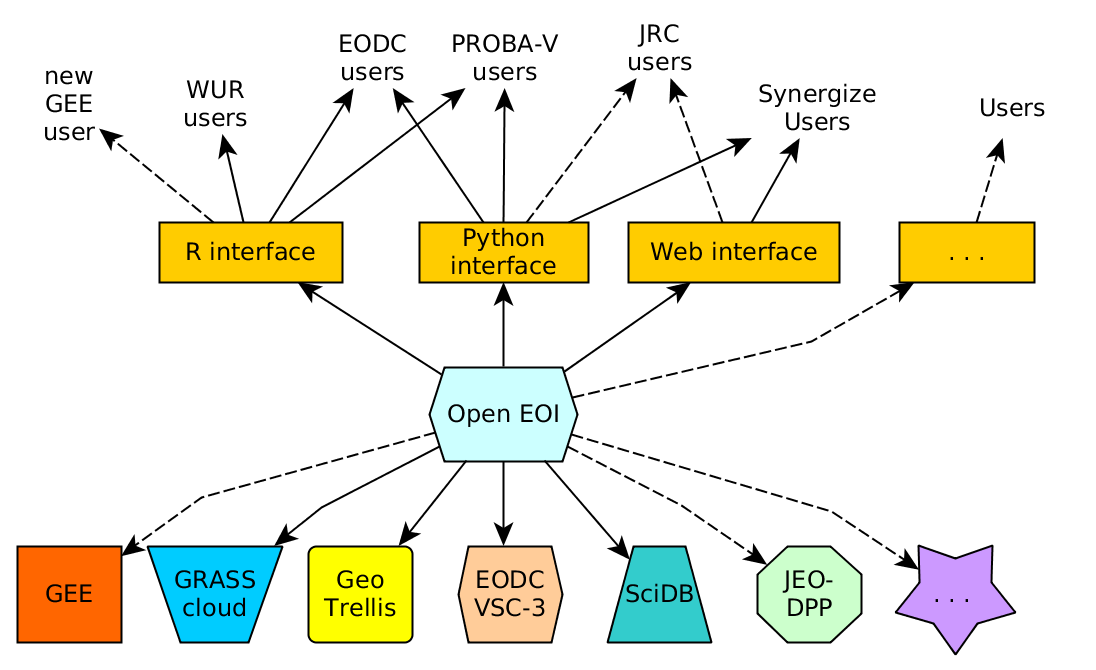
More in detail, and following the GDAL model closely, the architecture contains of
- a client and back-end neutral set of API’s for both sides, defining which functions users can call, and which functions back-ends have to obey to,
- a driver for each back-end that translates the neutral requirements into the platform specific offerings, or information that a certain function is not available (e.g. creating new datasets in a write-only back-end)
- a driver for each client that binds the interfaces to the particular front-end such as R or python
With an architecture like this, it would not only become easy and attractive for users to change from one back-end to the other, but also make it much easier to choose between back-ends, because the value propositions of the back-end providers are now comparable, on paper as well as in practice.
A rough idea of the architecture is shown in this figure:
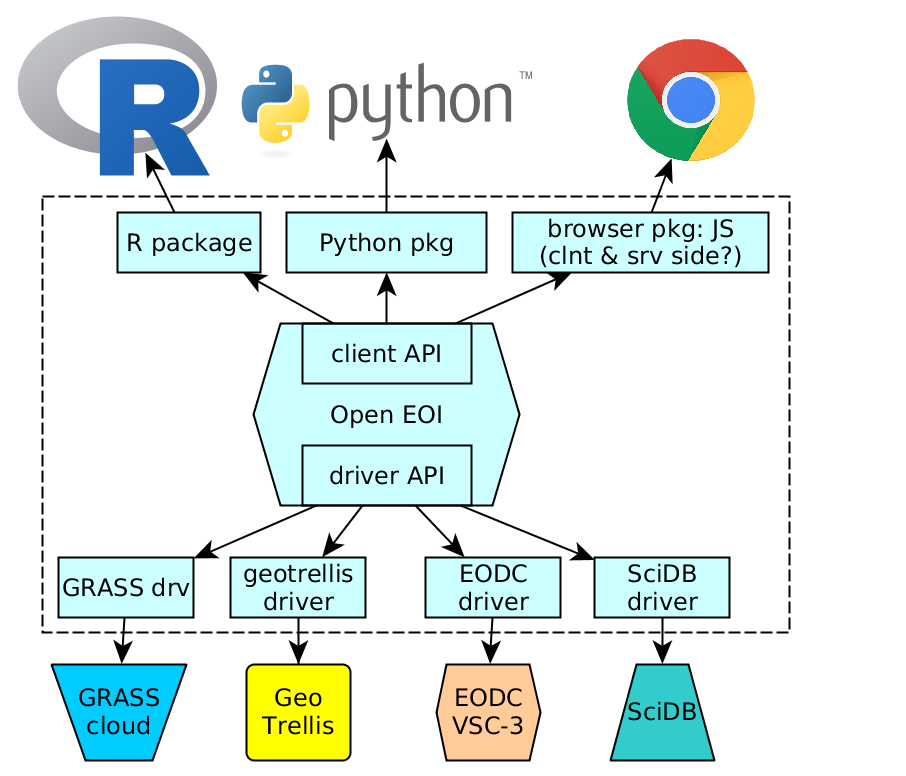
One of the drivers will interface collections of scenes in a back-end, or on the local hard drive. GDAL will remain playing an important role in back-ends if the back-end uses files in a format supported by GDAL, and in the front-end if the (small) results of big computations are fetched.
The way forward
We, as the authors of this piece, have started to work on these ideas in current activities, projects, and proposals. We are planning to submit a proposal to the EC H2020 call EO-2-2017: EO Big Data Shift. We hope that the call writers (and the reviewers) have the same problem in mind as what we explain above.
We are publishing this article because we believe this work has to be done, and only a concerted effort can realize it. When you agree and would like to participate, please get in touch with us. When successful, it will in the longer run benefit science, industry, and all of us.
Earlier blogs related to this topic
Earlier posts related to this:
- Breaking down barriers in the scientific use of EO data
- The future of R spatial
- Scalable Earth Observation analytics with R and SciDB
- Does rasdaman CE solve an open source geospatial problem?
We got funded!
News:
- the openEO project proposal mentioned above got 2M H2020 funding!
- information on the project can be found at http://openeo.org/
- the github organisation is found at https://github.com/open-eo/
