Scalable Earth Observation analytics with R and SciDB
- Introduction to SciDB
- Reproducing this blog
- Spacetime Arrays: The scidb4geo plugin
- A GDAL driver for SciDB arrays
- Scalable in-database analytics with R
- Discussion
The analysis of non-trivial amounts of Earth Observation (EO) data is complicated due to the need to first download imagery scene-by-scene, then mozaic them, then correct them, and finally de-cloud them or select images without clouds. Only when these steps have been done, a sensible analysis, e.g. for detecting environmental change such as forest loss, can be carried out. Many large research groups or private companies (including Google) have set up an infrastructure for this, but do not share this infrastructure with other researchers. As a consequence, many of the decisions and assumptions made during this process are not communicated, making Earth Observation science dominantly non-reproducible.
We developed a work flow that
- composes multiple spatial and temporal scenes in a 3- (x/y/t) or 4- (x/y/t/band) dimensional array,
- gives direct access to the composed arrays, using high-level scripting languages (R, python, Julia),
- uses a shared computing environment that scales up computation to anything from many cores to large clusters,
- uses exclusively open source software, and
- results in a 100% reproducible workflow.
Reproducing this workflow requires a bit more than running an R script, as the data base back-end also has to be set up, and filled. For this, we build the data base in a docker image, in order to simplify installation and separate the data base from other running system components.
Introduction to SciDB
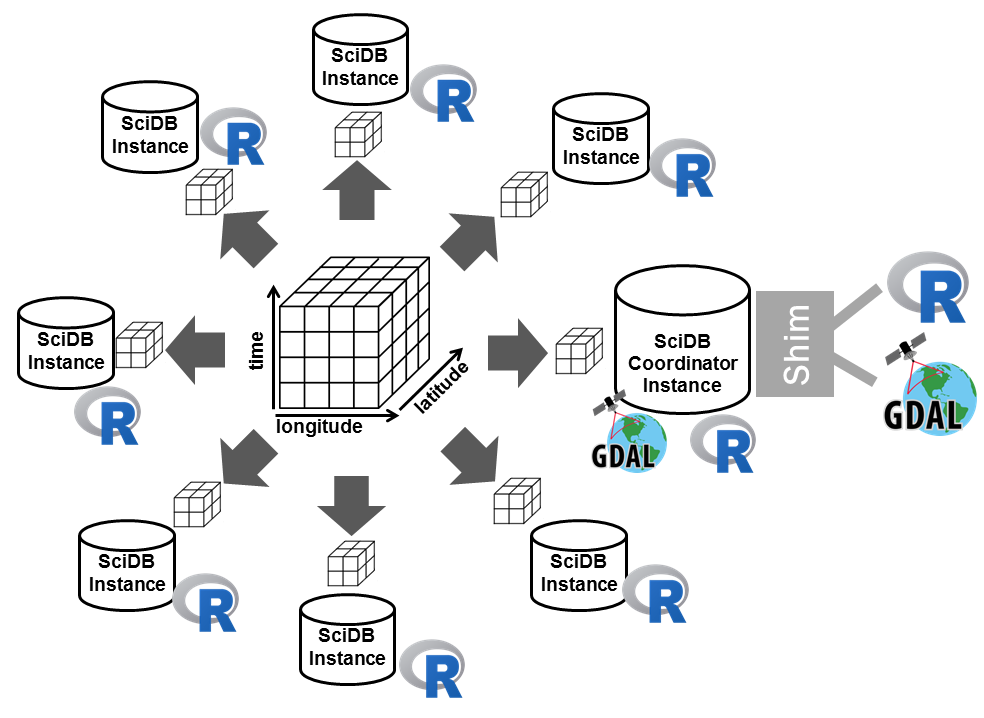
SciDB is a data management and analytics system for multidimensional array data. It scales from single machines to large clusters by distributing storage and computational load over several instances. Therefore, arrays are evenly divided by smaller-sized sub arrays called chunks which are then distributed over the instances. SciDB comes in two editions: an open source, community edition and an enterprise edition. Here, we use the community edition.
With regard to complex scientific analytics, SciDB offers the following features:
- Sparse array data model
- Use of ScaLAPACK, matrix operations are carried out in a distributed way
- High-level interfaces to R, python, and julia
- extensible by user defined functions
Reproducing this blog
To reproduce this blog, you need a running SciDB instance, and download quite a bit of data. To do both in a clean fashion, we use a docker image, which is built from a docker file. The material (docker file, scripts) to reproduce everything in this blog is found here.
Spacetime Arrays: The scidb4geo plugin
SciDB natively treats space or time not differently from other dimensions: dimensions are described by an integer index with a start value, the number of cells, and the chunk and chunk overlap sizes. This information is stored as array metadata in SciDB’s system catalog which held in a PostgreSQL database. To maintain geographic reference of arrays (what are the coordinates of the spacetime raster origin, what are the cell sizes), we added the necessary metadata to this PostgreSQL database.
For spatial reference, we store
- which dimensions correspond to latitude (northing) and longitude (easting),
- an affine transformation that relate integer array indexes to spatial coordinates, which is often just an offset and cell size vector, and
- the reference system as authority name, id pair and its WKT and proj4 definitions.
Notice that the plugin comes with all EPSG
definitions based on the PostGIS SPATIAL_REF_SYS table and that the
affine transformation corresponds to that used by
GDAL.
Similarly, the temporal reference stores
- which dimension refers to date or time,
- what the date / time at array cell 0 is, and
- what the temporal resolution, i.e. the temporal interval between successive array cells is.
Dates and time (periods) are given as specified in ISO 8601. Since time is usually irregular, this definition might seem very restrictive but using SciDB’s support for sparse arrays, a higher temporal resolution (e.g. of hours or days when images appear roughly monthly) often can regularize time without storage overhead.
The scidb4geo plugin adds new operators to SciDB’s query language AFL. These include very basic functionality for getting and setting geographic reference, general metadata, and very simple computations of the extent and to overlay two arrays based on their spatiotemporal footprint. Table 1 shows a complete list of new AFL operators. The plugin is available at github. Building from sources requires linking against the SciDB development libraries.
| Operator | Description |
|---|---|
eo_arrays() |
Lists geographically referenced arrays |
eo_setsrs() |
Sets the spatial reference of existing arrays |
eo_getsrs() |
Gets the spatial reference of existing arrays |
eo_regnewsrs() |
Registers custom spatial reference systems |
eo_extent() |
Computes the geographic extent of referenced arrays |
eo_cpsrs() |
Copies the spatial reference from one array to another array |
eo_settrs() |
Sets the temporal reference of arrays |
eo_gettrs() |
Gets the temporal reference of arrays |
eo_setmd() |
Sets key value metadata of arrays and array attributes |
eo_getmd() |
Gets key value metadata of arrays and array attributes |
eo_over() |
Overlays two geographically referenced arrays |
A GDAL driver for SciDB arrays
SciDB’s database load and input operators can create arrays from
files in CSV-like text and a custom binary format. The same is true for
the save operator to export arrays as files. To support reading and
writing SciDB arrays from and to files in a variety of raster formats,
we implemented an extension to the open-source Geospatial Data
Abstraction Library (GDAL). GDAL natively
supports over 100 multiband raster image formats and is internally used
by nearly all GIS software, open source and commercial.
To create a two-dimensional array from a GDAL dataset, our driver carries out the following steps
- Convert pixel data to SCIDB binary format
- Transport the data over the web to SciDB’s web service Shim
- Load the data as a one-dimension array using
load - Reshape the array to two dimensions
- Set the spatial reference
Notice that pixel data are processed in chunks. The download procedure works similarly:
- Fill empty cells with a default NA value
- Convert the array to a SciDB binary file using
save - Load the data over the web from SciDB’s web service Shim
- Create a GDAL dataset from pixel data
With the driver installed, the gdal_translate utility program can
automatically convert files in all formats supported by GDAL to and from
SciDB, and thereby subset arrays by spatial subwindow and band numbers
as well as modify metadata and rescale imagery (see the gdal_translate
manual for details).
The driver is available under an open-source license at github. Notice that since it is not yet integrated in the GDAL source code tree, right now it needs manual compilation and installation. Dependencies are libcurl and some Boost header-only libraries. The driver works on Windows, Mac, and Linux operating systems. For Linux, a simple bash script to build and install GDAL is available (see below).
Installation
The following system call installs GDAL version 2.0.1 with the new SciDB driver:
sudo ./install_gdal.sh # build and install GDAL
Note that this may overwrite previous GDAL installations. The github repository contains more detailed installation instruction.
GDAL operates on the client side, so must be installed there where R,
or a gdal utililty program, is being run as client to SciDB. After
installing the SciDB-enabled GDAL, the R package rgdal may have
to be re-installed, so that it links to the modified GDAL library.
Simple 2D arrays
Ingesting and downloading single raster files to single two-dimensional
arrays is done by the gdal_translate program. The following example
downloads a sample GeoTIFF file, uploads the file as a two-dimensional
array, calls gdalinfo directly on the SciDB array, and finally
downloads the data as a PNG image and loads this into R, to plot it with
spplot. For calling the gdal_translate and gdalinfo binaries, we
use the gdalUtils package; an alternative would be to directly use
system() calls to the gdal utilities.
require(gdalUtils)

# Create 2d array from single GeoTIFF

# delete array to avoid errors if already exists
gdalmanage(mode = "delete", datasetname = "SCIDB:array=chicago confirmDelete=Y" )

## NULL

download.file("http://download.osgeo.org/geotiff/samples/spot/chicago/UTM2GTIF.TIF", destfile = "chicago.tif")
gdal_translate(src_dataset = "chicago.tif", dst_dataset = "SCIDB:array=chicago", of = "SciDB")

## NULL

gdalinfo("SCIDB:array=chicago")

##  [1] "Driver: SciDB/SciDB array driver"
##  [2] "Files: none associated"
##  [3] "Size is 699, 929"
##  [4] "Coordinate System is:"
##  [5] "PROJCS[\"NAD27 / UTM zone 16N\","
##  [6] "    GEOGCS[\"NAD27\","
##  [7] "        DATUM[\"North_American_Datum_1927\","
##  [8] "            SPHEROID[\"Clarke 1866\",6378206.4,294.9786982139006,"
##  [9] "                AUTHORITY[\"EPSG\",\"7008\"]],"
## [10] "            AUTHORITY[\"EPSG\",\"6267\"]],"
## [11] "        PRIMEM[\"Greenwich\",0,"
## [12] "            AUTHORITY[\"EPSG\",\"8901\"]],"
## [13] "        UNIT[\"degree\",0.0174532925199433,"
## [14] "            AUTHORITY[\"EPSG\",\"9122\"]],"
## [15] "        AUTHORITY[\"EPSG\",\"4267\"]],"
## [16] "    UNIT[\"metre\",1,"
## [17] "        AUTHORITY[\"EPSG\",\"9001\"]],"
## [18] "    PROJECTION[\"Transverse_Mercator\"],"
## [19] "    PARAMETER[\"latitude_of_origin\",0],"
## [20] "    PARAMETER[\"central_meridian\",-87],"
## [21] "    PARAMETER[\"scale_factor\",0.9996],"
## [22] "    PARAMETER[\"false_easting\",500000],"
## [23] "    PARAMETER[\"false_northing\",0],"
## [24] "    AUTHORITY[\"EPSG\",\"26716\"],"
## [25] "    AXIS[\"Easting\",EAST],"
## [26] "    AXIS[\"Northing\",NORTH]]"
## [27] "Origin = (444650.000000000000000,4640510.000000000000000)"
## [28] "Pixel Size = (10.000000000000000,-10.000000000000000)"
## [29] "Metadata:"
## [30] "  AREA_OR_POINT=Area"
## [31] "  TIFFTAG_RESOLUTIONUNIT=1 (unitless)"
## [32] "  TIFFTAG_XRESOLUTION=72"
## [33] "  TIFFTAG_YRESOLUTION=72"
## [34] "Corner Coordinates:"
## [35] "Upper Left  (  444650.000, 4640510.000) ( 87d40' 2.80\"W, 41d54'59.49\"N)"
## [36] "Lower Left  (  444650.000, 4631220.000) ( 87d39'59.67\"W, 41d49'58.28\"N)"
## [37] "Upper Right (  451640.000, 4640510.000) ( 87d34'59.37\"W, 41d55' 1.14\"N)"
## [38] "Lower Right (  451640.000, 4631220.000) ( 87d34'56.64\"W, 41d49'59.92\"N)"
## [39] "Center      (  448145.000, 4635865.000) ( 87d37'29.62\"W, 41d52'29.73\"N)"
## [40] "Band 1 Block=699x929 Type=Byte, ColorInterp=Undefined"
## [41] "  Minimum=6.000, Maximum=255.000, Mean=115.044, StdDev=50.709"

# download 2d array as a png and plot in R
gdal_translate(src_dataset = "SCIDB:array=chicago", dst_dataset = "chicago.png" , of = "PNG")

## NULL

require(rgdal)
img = readGDAL("chicago.png")

## chicago.png has GDAL driver PNG
## and has 929 rows and 699 columns

spplot(img)
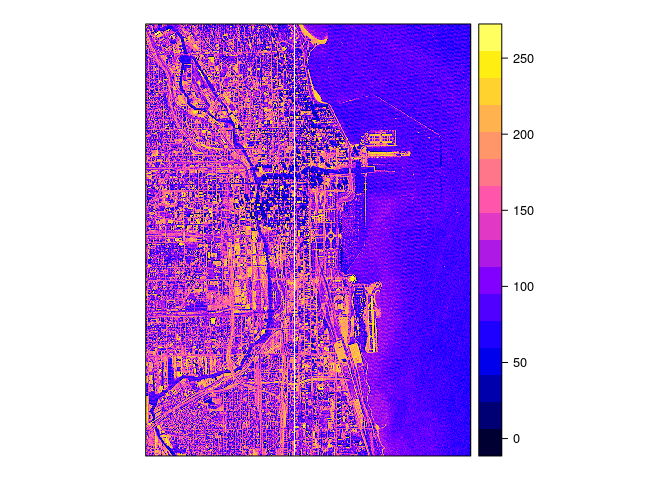
(White lines are an artifact of plotting dense grids)
Mosaicing multi-tiled 2D arrays
Earth-observation imagery usually comes in spatially tiled files, i.e. a
single file covers a limited, rectangular region of interest. The GDAL
driver for SciDB supports loading tiled datasets into a single
two-dimensional array. For this, we call gdal_translate iteratively
and append tiles to an array, creating a mosaic. Based on their spatial
extent, array coordinates are then automatically computed such that
tiles are ingested to the correct position. For this, the spatial
reference system of all tiles must be identical. In the R code example,
we download 7 SRTM tiles covering Ethopia and ingest them to a single
SciDB array called “srtm”.
# SRTM example over Ethopia

require(gdalUtils)

# download files, this might take some time(!)
source("download.srtm.R")

# find files
files = list.files(path = "srtm", pattern = "*.tif", full.names = TRUE)

# delete array to avoid errors if already exists
gdalmanage(mode = "delete",datasetname = "SCIDB:array=srtm confirmDelete=Y")

## NULL

# Create a 2d SciDB array with given extent and add first image
# this may produce an error if array already exists
gdal_translate(src_dataset = files[1],
               dst_dataset = "SCIDB:array=srtm", of = "SciDB",
               co = list("bbox=30 5 50 15", "srs=EPSG:4326", "type=S"))

## NULL

# Iteratively add further images to this array
for (i in 2:length(files)) { # takes around 2 minutes each on my machine
  gdal_translate(verbose = T, src_dataset = files[i],  dst_dataset = "SCIDB:array=srtm", of = "SciDB", co = list("type=S", "srs=EPSG:4326"))
}

## Checking gdal_installation...

## Scanning for GDAL installations...

## Checking the gdalUtils_gdalPath option...

## GDAL version 2.0.1

## GDAL command being used: "/usr/local/bin/gdal_translate" -of "SciDB" -co "type=S" -co "srs=EPSG:4326" "srtm/srtm_43_11.tif" "SCIDB:array=srtm"

## Input file size is 6001, 60010...10...20...30...40...50...60...70...80...90...100 - done.

## Checking gdal_installation...

## Scanning for GDAL installations...

## Checking the gdalUtils_gdalPath option...

## GDAL version 2.0.1

## GDAL command being used: "/usr/local/bin/gdal_translate" -of "SciDB" -co "type=S" -co "srs=EPSG:4326" "srtm/srtm_44_10.tif" "SCIDB:array=srtm"

## Input file size is 6001, 60010...10...20...30...40...50...60...70...80...90...100 - done.

## Checking gdal_installation...

## Scanning for GDAL installations...

## Checking the gdalUtils_gdalPath option...

## GDAL version 2.0.1

## GDAL command being used: "/usr/local/bin/gdal_translate" -of "SciDB" -co "type=S" -co "srs=EPSG:4326" "srtm/srtm_44_11.tif" "SCIDB:array=srtm"

## Input file size is 6001, 60010...10...20...30...40...50...60...70...80...90...100 - done.

## Checking gdal_installation...

## Scanning for GDAL installations...

## Checking the gdalUtils_gdalPath option...

## GDAL version 2.0.1

## GDAL command being used: "/usr/local/bin/gdal_translate" -of "SciDB" -co "type=S" -co "srs=EPSG:4326" "srtm/srtm_45_10.tif" "SCIDB:array=srtm"

## Input file size is 6001, 60010...10...20...30...40...50...60...70...80...90...100 - done.

## Checking gdal_installation...

## Scanning for GDAL installations...

## Checking the gdalUtils_gdalPath option...

## GDAL version 2.0.1

## GDAL command being used: "/usr/local/bin/gdal_translate" -of "SciDB" -co "type=S" -co "srs=EPSG:4326" "srtm/srtm_45_11.tif" "SCIDB:array=srtm"

## Input file size is 6001, 60010...10...20...30...40...50...60...70...80...90...100 - done.

## Checking gdal_installation...

## Scanning for GDAL installations...

## Checking the gdalUtils_gdalPath option...

## GDAL version 2.0.1

## GDAL command being used: "/usr/local/bin/gdal_translate" -of "SciDB" -co "type=S" -co "srs=EPSG:4326" "srtm/srtm_46_11.tif" "SCIDB:array=srtm"

## Input file size is 6001, 60010...10...20...30...40...50...60...70...80...90...100 - done.
Running gdalinfo shows that the created array has 24001 x 12001
pixels.
require(gdalUtils)
gdalinfo("SCIDB:array=srtm")

##  [1] "Driver: SciDB/SciDB array driver"
##  [2] "Files: none associated"
##  [3] "Size is 24001, 12001"
##  [4] "Coordinate System is:"
##  [5] "GEOGCS[\"WGS 84\","
##  [6] "    DATUM[\"WGS_1984\","
##  [7] "        SPHEROID[\"WGS 84\",6378137,298.257223563,"
##  [8] "            AUTHORITY[\"EPSG\",\"7030\"]],"
##  [9] "        AUTHORITY[\"EPSG\",\"6326\"]],"
## [10] "    PRIMEM[\"Greenwich\",0,"
## [11] "        AUTHORITY[\"EPSG\",\"8901\"]],"
## [12] "    UNIT[\"degree\",0.0174532925199433,"
## [13] "        AUTHORITY[\"EPSG\",\"9122\"]],"
## [14] "    AUTHORITY[\"EPSG\",\"4326\"]]"
## [15] "Origin = (29.999583333323201,15.000416884586100)"
## [16] "Pixel Size = (0.000833333333333,-0.000833333333333)"
## [17] "Metadata:"
## [18] "  AREA_OR_POINT=Area"
## [19] "Corner Coordinates:"
## [20] "Upper Left  (  29.9995833,  15.0004169) ( 29d59'58.50\"E, 15d 0' 1.50\"N)"
## [21] "Lower Left  (  29.9995833,   4.9995836) ( 29d59'58.50\"E,  4d59'58.50\"N)"
## [22] "Upper Right (  50.0004167,  15.0004169) ( 50d 0' 1.50\"E, 15d 0' 1.50\"N)"
## [23] "Lower Right (  50.0004167,   4.9995836) ( 50d 0' 1.50\"E,  4d59'58.50\"N)"
## [24] "Center      (  40.0000000,  10.0000002) ( 40d 0' 0.00\"E, 10d 0' 0.00\"N)"
## [25] "Band 1 Block=2048x2048 Type=Int16, ColorInterp=Undefined"
## [26] "  Minimum=-197.000, Maximum=4517.000, Mean=926.244, StdDev=684.170"
## [27] "  NoData Value=-32768"
Using the rgdal package, we can directly download the array to R. However, rgdal does not support subsetting by spatial coordinates, so the following command uses array indexes to define a window of interest.
require(rgdal)
srtm.sp = readGDAL("SCIDB:array=srtm",offset = c(8000,3000), region.dim = c(1000,1000) )

## SCIDB:array=srtm has GDAL driver SciDB
## and has 12001 rows and 24001 columns

spplot(srtm.sp,  scales = list(TRUE))
Multi-temporal, 3-D arrays
The GDAL driver also allows to sucessively add images as time slices into a three-dimensional spacetime array. During the ingestion of the first image, we must specify that the image should be rearranged as a three-dimensional array and we must define the temporal resolution of the target array as ISO 8601 string for time periods, and provide the date or time of the image. For subsequent images, only the date or time must be provided for ingestion. The correct temporal index is then derived automatically. Since there is no standard metadata field for time and date of datasets in the GDAL API, the date and time must be provided manually or derived e.g. from filenames of individual images. Similarly, the R code below demonstrates how to download one MODIS tile at different dates using the MODIS R package and how to build a 3-D SciDB array from these files.
Since the MODIS sinusoidal projection is not in the EPSG registry, we
use a parameter of gdal_translate to overwrite the projection with
authority and ID from
spatialreference.org. The database plugin
then automatically downloads proj4 and WKT definitions.
require(MODIS)
## Loading required package: MODIS
## Loading required package: raster
## MODIS_manual: https://ivfl-rio.boku.ac.at/owncloud/public.php?service=files&t=660dc830afb091237cc40b3dea2fdf6b
##
## Attaching package: 'MODIS'
## The following object is masked from 'package:base':
##
## file.size
require(gdalUtils)
MODISoptions(localArcPath = paste(getwd(), "MODIS", sep="/"))
## To install all required and suggested packages run:
## setRepositories() # activate CRAN, R-forge, and Omegahat and then:
## install.packages(c(' ptw '),dependencies=TRUE)
##
## 'MRT_HOME' not set/found! MRT is NOT enabled! See: 'https://lpdaac.usgs.gov/tools/modis_reprojection_tool'
## Detecting available write drivers!
## Found: 63 candidate drivers, detecting file extensions...
## 0 usable drivers detected!
##
## STORAGE:
## _______________
## localArcPath : /home/edzer/marius/MODIS
## outDirPath : /home/edzer/MODIS_ARC/PROCESSED
##
##
## DOWNLOAD:
## _______________
## MODISserverOrder : LPDAAC, LAADS
## dlmethod : auto
## stubbornness : high
##
##
## PROCESSING:
## _______________
## GDAL : GDAL 2.0.1, released 2015/09/15
## MRT : Not available. Use 'MODIS:::checkTools('MRT')' for more information!
## pixelSize : asIn
## outProj : asIn
## resamplingType : NN
## dataFormat : GTiff
##
##
## DEPENDENCIES:
## _______________
##
hdf.download = getHdf("MOD13A3",begin="2000-01-01", end="2005-01-01",tileH = 12, tileV = 9,collection = "005")
## Loading required package: rgeos
## rgeos version: 0.3-8, (SVN revision 460)
## GEOS runtime version: 3.4.2-CAPI-1.8.2 r3921
## Polygon checking: TRUE
# MODIS HDF files have subdatasets for bands, we only want NDVI
filenames = basename(hdf.download$MOD13A3.005)
datasets = paste0("HDF4_EOS:EOS_GRID:", hdf.download$MOD13A3.005, ":MOD_Grid_monthly_1km_VI:1 km monthly NDVI")
gdalmanage(mode = "delete",datasetname = "SCIDB:array=MOD13A3 confirmDelete=Y" )
## NULL
# MODIS sinusoidal is not in SPATIAL_REF_SYS and must be added
wkt = "PROJCS[\"Sinusoidal\",GEOGCS[\"GCS_Undefined\",DATUM[\"Undefined\",SPHEROID[\"User_Defined_Spheroid\",6371007.181,0.0]],PRIMEM[\"Greenwich\",0.0],UNIT[\"Degree\",0.0174532925199433]],PROJECTION[\"Sinusoidal\"],PARAMETER[\"False_Easting\",0.0],PARAMETER[\"False_Northing\",0.0],PARAMETER[\"Central_Meridian\",0.0],UNIT[\"Meter\",1.0],AUTHORITY[\"SR-ORG\",\"6842\"]]"
# Create a 3d SciDB spacetime array and add first image
# this may produce an error if array already exists
gdal_translate(src_dataset = datasets[1],
dst_dataset = "SCIDB:array=MOD13A3", of = "SciDB", a_srs = wkt,
co = list("t=2000-01", "dt=P1M", "type=STS"))
## NULL
# Iteratively add further images to this array
for (i in 2:length(datasets)) {
d = strptime(substr(filenames[i],10,16), format="%Y%j")
gdal_translate(src_dataset = datasets[i], dst_dataset = "SCIDB:array=MOD13A3", of = "SciDB", a_srs = wkt, co = list("type=ST", "dt=P1M", paste("t=",format(d,"%Y-%m"),sep="")))
}
...
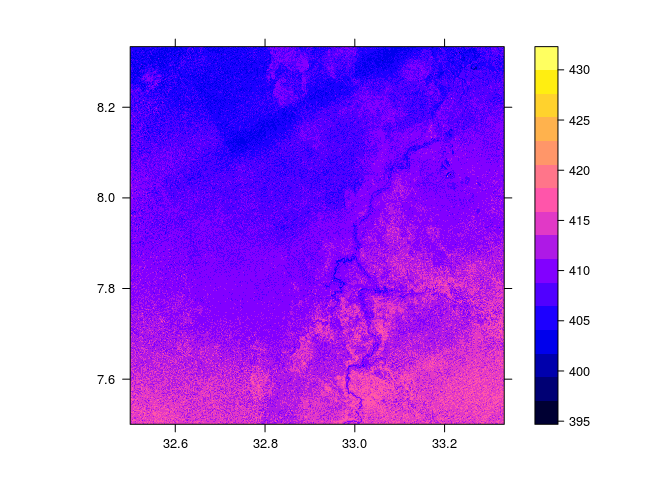
# Download temporal slice
gdal_translate(src_dataset = "SCIDB:array=MOD13A3[t,2001-04-01]", dst_dataset = "mod.tif" , of = "GTiff")
...
## NULL
require(rgdal)
img = readGDAL("mod.tif")
## mod.tif has GDAL driver GTiff
## and has 1200 rows and 1200 columns
spplot(img)
Scalable in-database analytics with R
So far, we used the database only as a data store. The effort in previous steps pays off as soon as we scale complex analyses under the following principles: (i) move the analysis to the data instead of moving the data to our analysis, (ii) exploit parallelism in our computations such that execution time reduces linearly with hardware resources, and (iii) reuse of code developed on a local machine instead in a familiar language, such as R.
With regard to (iii), SciDB offers two different ways to interface with R. On the one hand, R can be used as a database client where essential operations use R syntax but automatically translate to database operations using the SciDBR package. On the other hand, R scripts can be executed in database queries with the r_exec database plugin. The key for the second option is that the same R script is called independently on each array chunk. For this, chunk sizes must be adjusted to fit the analysis: running R functions on pixel time series would requires that individual array chunks hold the complete time series.
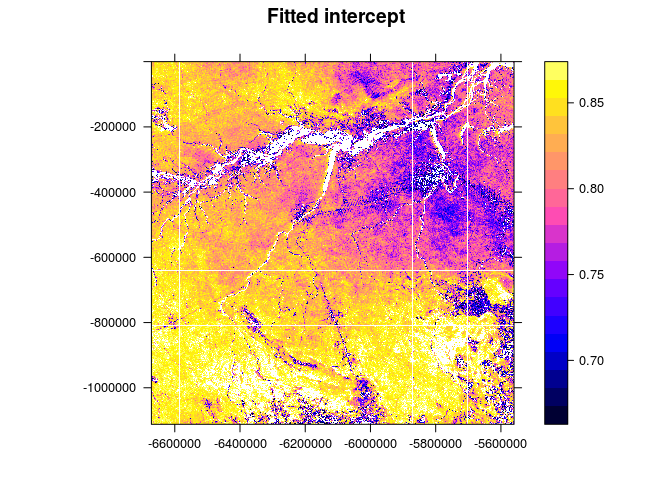
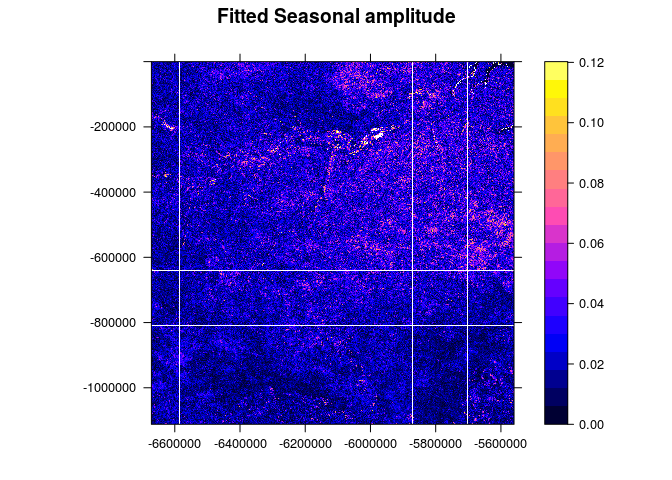
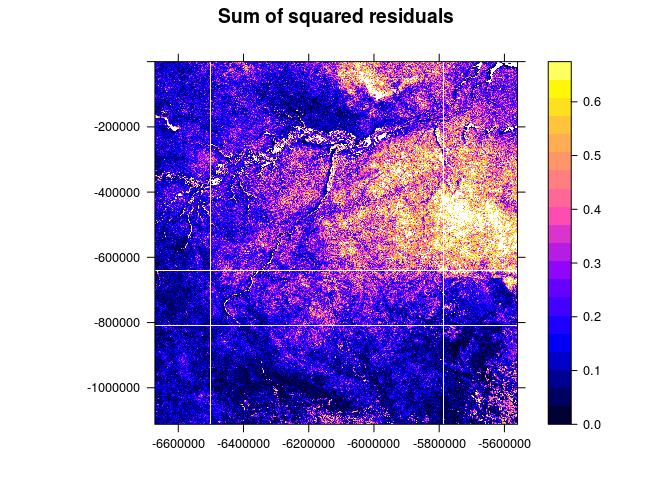
The script below demonstrates how time-series analysis can be scaled up from R and still meet the aforementioned principles. We rearrange the three-dimensional MODIS array to hold the complete time series of 64x64 pixels in individual chunks first, apply a simple centered mean filter, and fit a simple harmonic model to capture annual variability of the NDVI afterwards. Resulting parameters (intercept, amplitude, and phase shift) are returned as attributes in a two-dimensional array.
# r_exec should be already installed in the Docker container (scripts are provided)
# devtools::install_github("Paradigm4/SciDBR", ref="laboratory")

# remove previously created arrays
gdalmanage(mode = "delete",datasetname = "SCIDB:array=MOD13A3_T confirmDelete=Y" )

## NULL

gdalmanage(mode = "delete",datasetname = "SCIDB:array=MOD13A3_MODEL_OUTPUT confirmDelete=Y" )

## NULL

gdalmanage(mode = "delete",datasetname = "SCIDB:array=MOD13A3_MODEL_SP confirmDelete=Y" )

## NULL

require(scidb)

## Loading required package: scidb

##    ____    _ ___  ___
##   / __/___(_) _ \/ _ )
##  _\ \/ __/ / // / _  |
## /___/\__/_/____/____/     Copyright 2016, Paradigm4, Inc.

##
## Attaching package: 'scidb'

## The following object is masked from 'package:rgdal':
##
##     project

## The following object is masked from 'package:sp':
##
##     dimensions

## The following objects are masked from 'package:stats':
##
##     phyper, qhyper

scidbconnect(host = SCIDB_HOST,port=SCIDB_PORT, username = SCIDB_USER, password = SCIDB_PW, auth_type = "digest",protocol = "https")


#1. Rearrange chunks to contain complete time series and convert integers to NDVI doubles
query.preprocess = "store(merge(repart(project(apply(MOD13A3,ndvi,double(band1) / 10000.0),ndvi),<ndvi : double>[y=0:1199,64,0, x=0:1199,64,0, t=0:*,256,0]), build(<ndvi : double>[y=0:1199,64,0, x=0:1199,64,0, t=0:60,256,0],-1)), MOD13A3_T)"
iquery(query.preprocess)


#2. Apply R function over individual time series
query.R = "store(unpack(r_exec(project(apply(MOD13A3_T,X,double(x),Y,double(y),T,double(t)), ndvi,X,Y,T),'output_attrs=6','expr=
dim1 = length(unique(Y))
dim2 = length(unique(X))
dim3 = length(unique(T))
ndvi = array(ndvi,c(dim3,dim2,dim1))
t = 1:dim3
ndvi.fitted = apply(ndvi,c(3,2),function(x) {
  x[which(x < -0.29)] = NA
  x = filter(x,c(1,1,1)/3,circular=TRUE)
  if (all(is.na(x))) return(c(0,0,0,-1))
  ndvi.seasonal = lm(x ~ sin(t/6) + cos(t/6))
  intercept = coef(ndvi.seasonal)[1]
  ampl  = sqrt(coef(ndvi.seasonal)[2]^2 + coef(ndvi.seasonal)[3]^2 )
  phase = atan2(coef(ndvi.seasonal)[2],coef(ndvi.seasonal)[3])
  ssr = sum(residuals(ndvi.seasonal)^2)
  return(c(intercept, ampl, phase, ssr))
})
coords = expand.grid(unique(Y),unique(X))
list(as.double(coords[,1]),as.double(coords[,2]), ndvi.fitted[1,,], ndvi.fitted[2,,], ndvi.fitted[3,,], ndvi.fitted[4,,]  )'),i), MOD13A3_MODEL_OUTPUT)"

iquery(query.R)


# 3. Reshape the array to two dimensions
query.postprocess = "store(redimension(project(apply(MOD13A3_MODEL_OUTPUT,y,int64(expr_value_0), x,int64(expr_value_1), p0,expr_value_2, p1, expr_value_3, p2, expr_value_4, ssr, expr_value_5),y,x,p0,p1,p2,ssr), <p0 : double, p1 : double, p2 : double, ssr : double>[y=0:1199,2048,0, x=0:1199,2048,0]), MOD13A3_MODEL_SP)"

iquery(query.postprocess)
iquery("eo_setsrs(MOD13A3_MODEL_SP,'x','y','SR-ORG',6842,'x0=-6671703.118 y0=0 a11=926.625433055833 a22=-926.625433055833 a12=0 a21=0')")
The result array MOD13A3_MODEL_SP has spatial reference and can be
downloaded using GDAL as below.
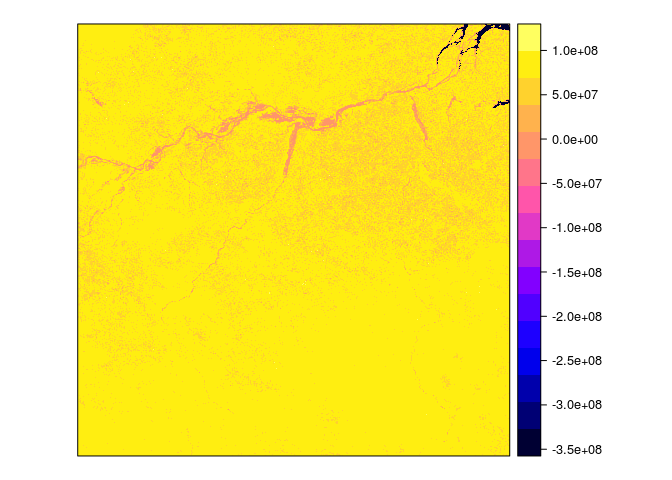
# 4. download and plot result array
require(gdalUtils)
gdal_translate(src_dataset = "SCIDB:array=MOD13A3_MODEL_SP", dst_dataset = "ndvi.tif" , of = "GTiff")

## Warning: running command '"/usr/local/bin/gdal_translate" -of "GTiff"
## "SCIDB:array=MOD13A3_MODEL_SP" "ndvi.tif"' had status 139

## NULL

require(rgdal)
img = readGDAL("ndvi.tif")

## ndvi.tif has GDAL driver GTiff
## and has 1200 rows and 1200 columns

spplot(img[1], scales = list(T), at=seq(quantile(img$band1,0.05),quantile(img$band1,0.95),length.out = 21), main="Fitted intercept")
spplot(img[2], scales = list(T), at=seq(0,quantile(img$band2,0.999,na.rm = T),length.out = 21), main="Fitted Seasonal amplitude")
spplot(img[4], scales = list(T), at=seq(0,quantile(img$band4,0.95),length.out = 21), main="Sum of squared residuals")
The analyses required some manual SciDB query language operations to reshape arrays, change attribute datatypes, or remove attributes. Most of the pre- and postprocessing except the actual R query could be also done using the SciDB R package. We acknowledge that plain AFL queries might be a hurdle from the perspective of a data analyst but we see many possibilities to simplify this in the future.
Discussion
We present an approach to scale up earth-observation analytics with open source software, using R and SciDB, and do this in a completely transparent and reproducible way. From a data scientist perspective, the approach requires relatively little learning effort by doing all neccessary steps in R. It separates the concerns of mosaicing time series of tiles into a multi-dimensional array (``data cube’’), and running models on this array in parallel. Reproduction is made simple by setting up SciDB in a docker container.
We see still a lot of room for improvement, e.g. by
- running R scripts within SciDB queries using the
r_execplugin still requires manual bookkeeping of coordinates, - automating and optimizing how arrays are chunked in SciDB,
- converting classes of R packages
sp,spacetimeorrasterdirectly to scalable SciDB queries (GDAL does not support time).
The core SciDB operations only work on integer array indexes. We
believe that SciDB has a useful set of operations but overwriting
them to take spatiotemporal coordinates as input and produce
referenced arrays would improve the usability of SciDB. A simple
approach to achieve this could be to extend the SciDBR package by
an S4 class for earth observation arrays and overwrite its methods.
In our demonstration, we exclusively used R. However, since our extensions work directly in the database and use GDAL, one could also use python or Julia, which have similar interfaces to SciDB and GDAL. This approach could be the basis for future activities towards open and reproducible large-scale Earth Observation science.
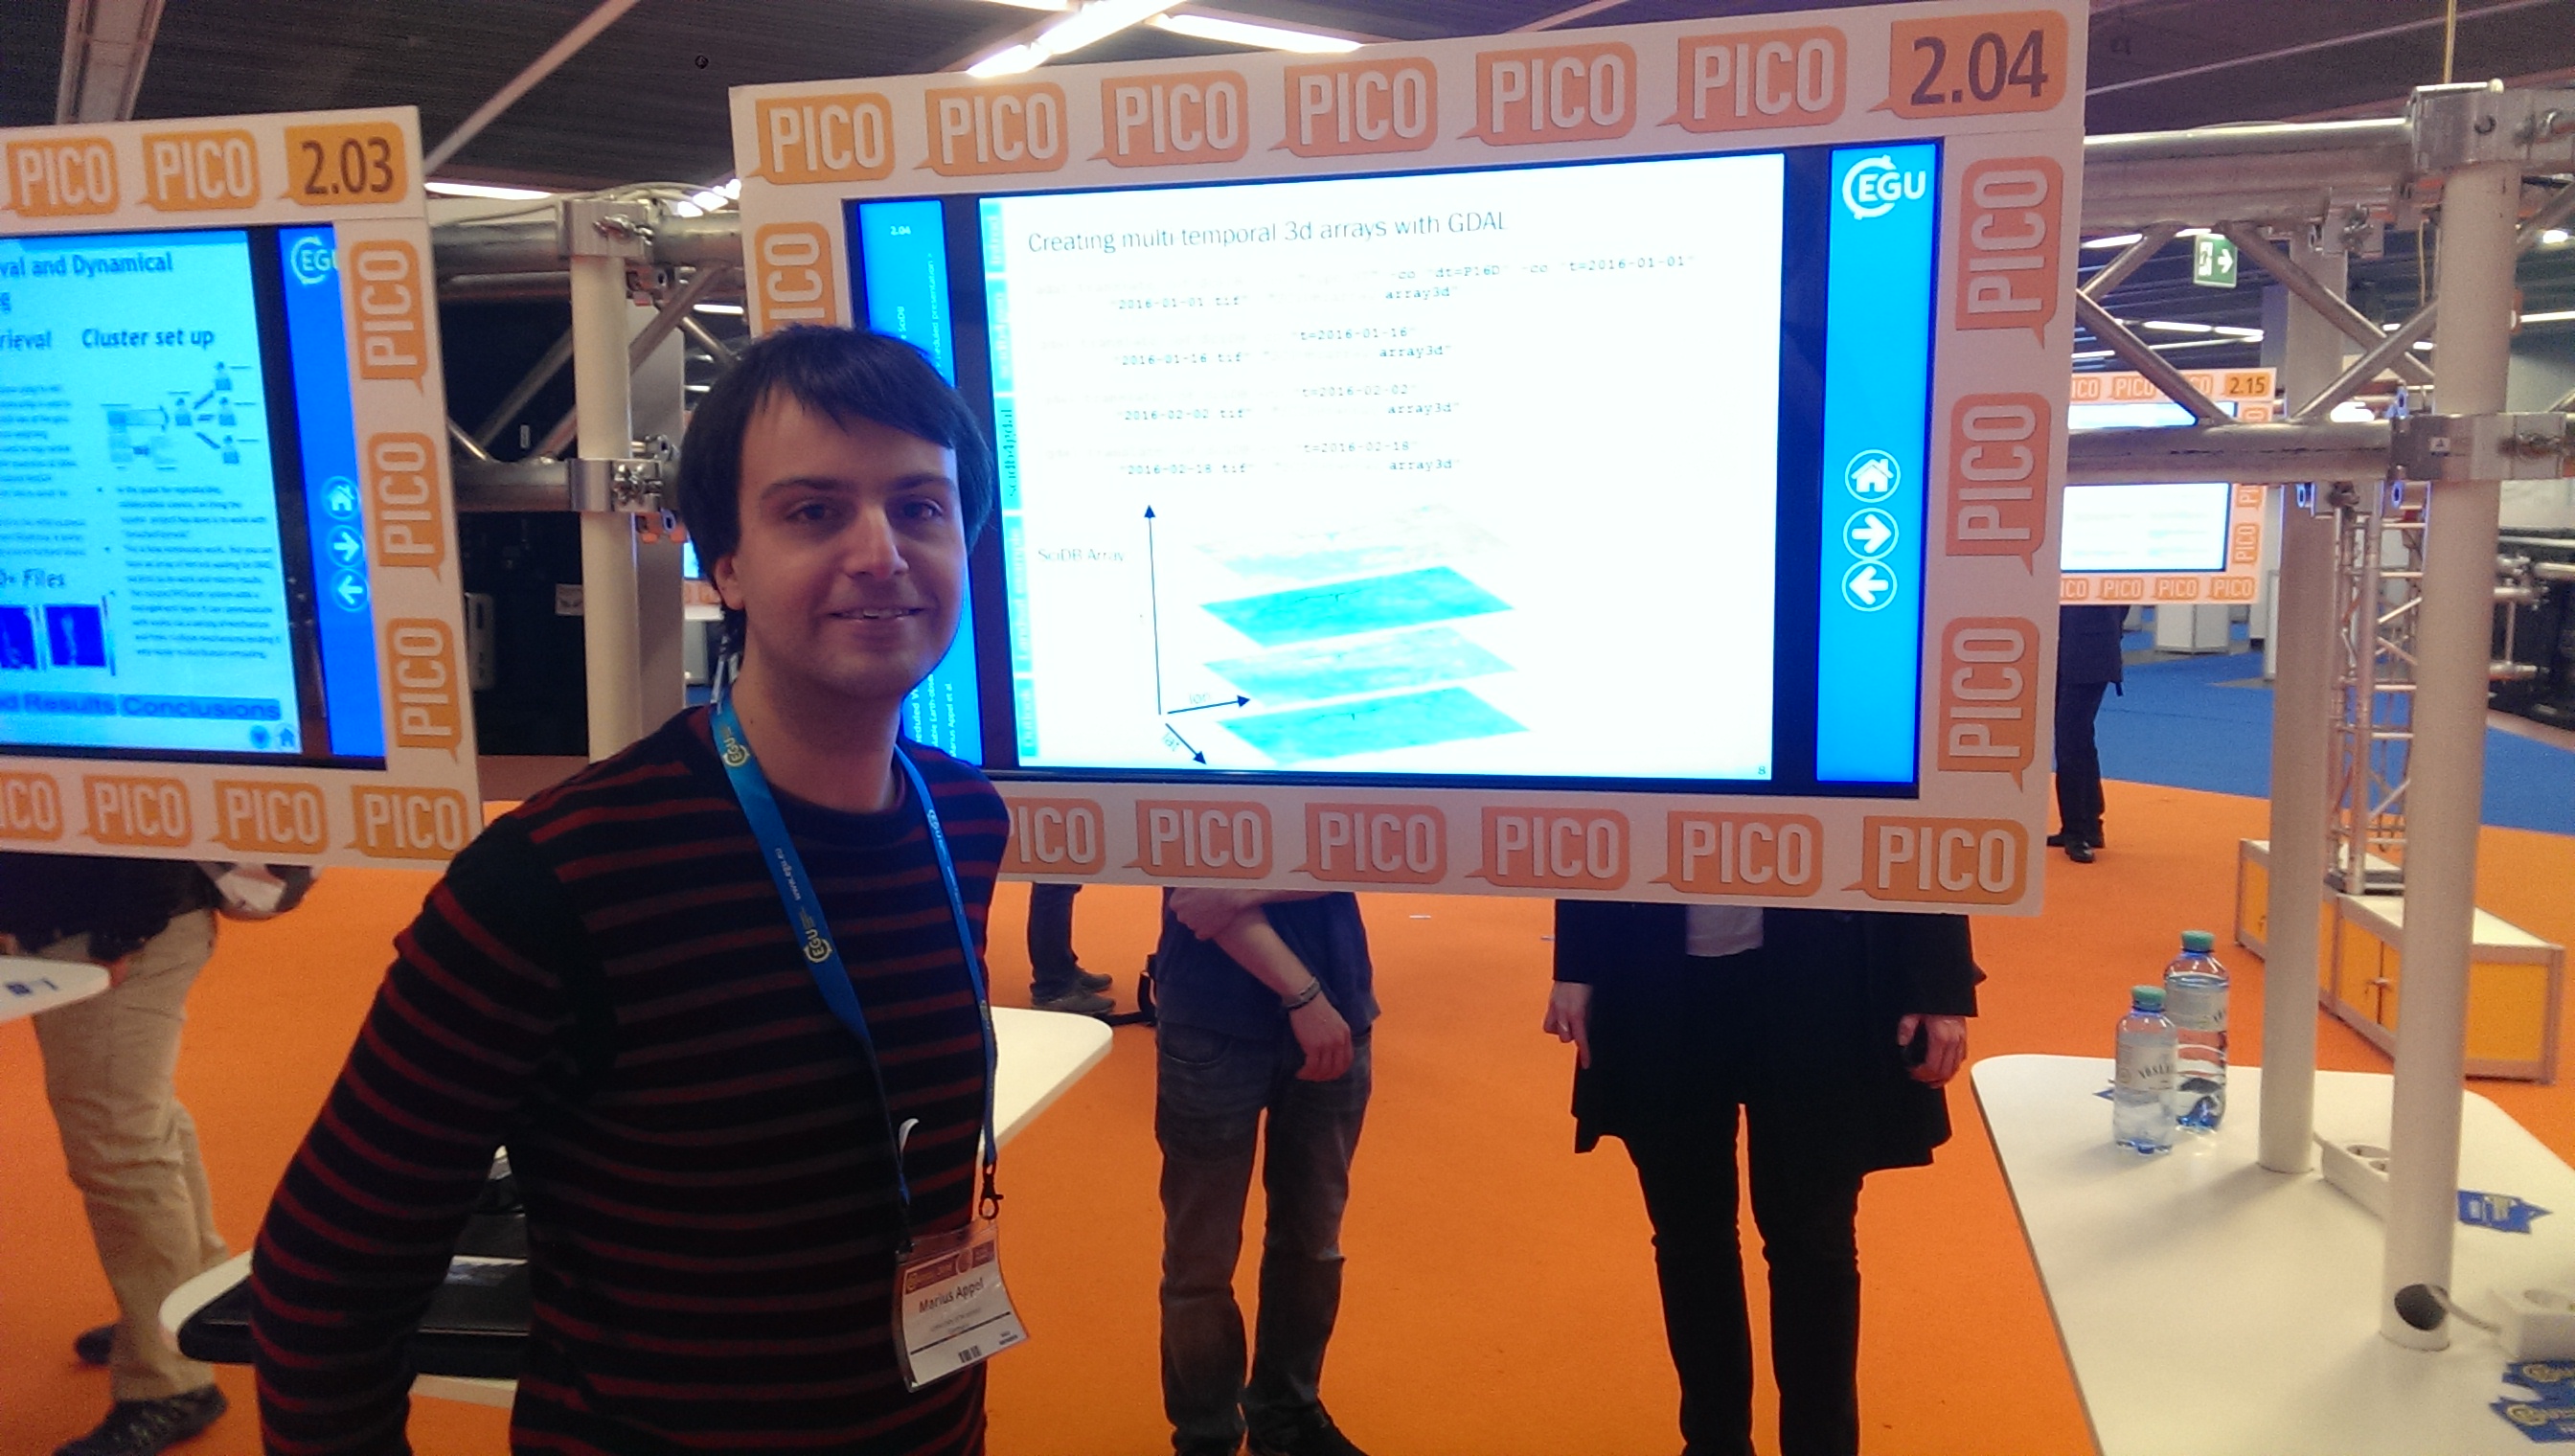
This blog post is a follow-up on our EGU poster, and acknowledgments go to Florian Lahn, Wouter Buytaert, and Simon Moulds. The original R-markdown file is found here.