Automatic units in axis labels
- Automatic unit handling
- Automatic measurement units in axis labels
- How to do this with ggplot?
- Update of Dec 2, 2016
- Related posts/articles
This blog post concerns the development version of units, installed by
devtools::install_github("edzer/units")
Have you ever tried to properly add measurement units to R plots? It might go like this:
xlab = parse(text = "temperature ~~ group('[', degree * C, ']')")
ylab = parse(text = "speed ~~ group('[', m * ~~ s^-1, ']')")
par(mar = par("mar") + c(0, .3, 0, 0)) # avoids cutting of superscript
plot(3 + 1:10 + 2 * rnorm(10), xlab = xlab, ylab = ylab)
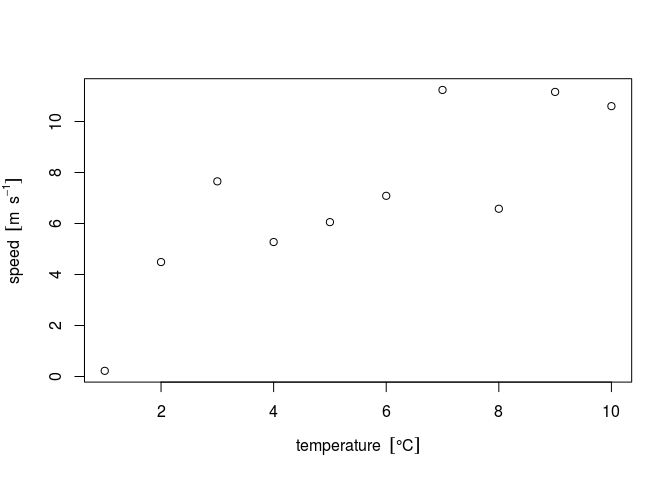
The main observation is, of course that it can be done. However,
- it looks geeky, and not quite intuitive
- you would typically postpone this work to just before submitting the paper, or during review
- you need this so infrequently that you tend to forget how it works.
Although well-written help is found in ?plotmath, all three
observations cause frustration.
The original
paper
desribing plotmath is by Paul Murrell and Ross Ihaka. R
core member Paul Murrell
also wrote package grid, part of base R. Few people use it directly,
but without it ggplot2 or
lattice could not exist.
Automatic unit handling
The new units CRAN package now makes working with units
- easier
- automatic, and
- less error-prone
Here is an example using mtcars. First, we specify the imperial units
to those known in the
udunits2
database:
library(units)
gallon = make_unit("gallon")
consumption = mtcars$mpg * with(ud_units, mi/gallon)
displacement = mtcars$disp * ud_units[["in"]]^3
For displacement, we cannot use the normal lookup in the database
displacement = mtcars$disp * with(ud_units, in)
because in (inch) is also a reserved word in R.
We convert these values to SI units by
units(displacement) = with(ud_units, cm^3)
units(consumption) = with(ud_units, km/l)
consumption[1:5]

## Units: km/l
## [1] 8.928017 8.928017 9.693276 9.098075 7.950187
Automatic measurement units in axis labels
We can plot these numeric variabes of type units by
par(mar = par("mar") + c(0, .1, 0, 0)) # avoids cutting of brackets at lhs
plot(displacement, consumption)
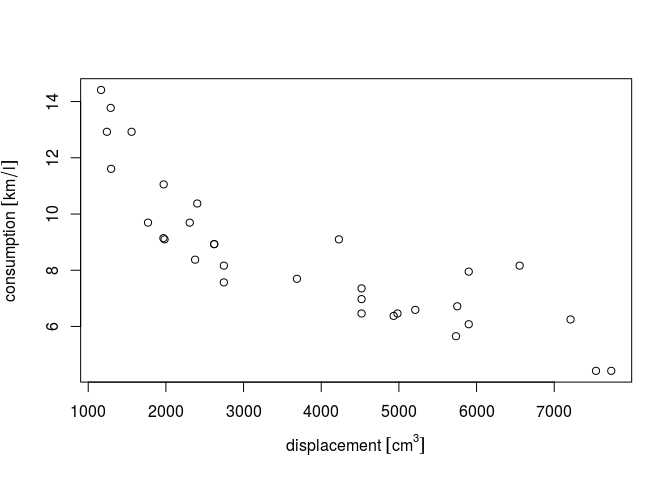
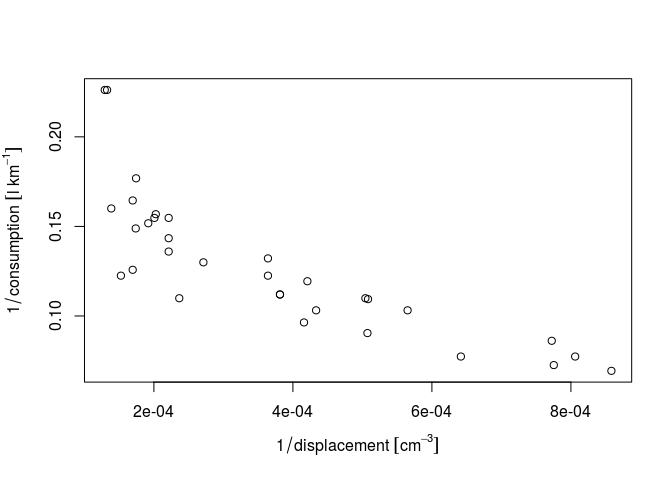
The units automatically appear in axis labels! If we want to have negative power instead of division bars, we can set a global option
units_options(negative_power = TRUE) # division becomes ^-1
Expressions such as
1/displacement [1:10]

## Units: cm^-3
##  [1] 0.0003813984 0.0003813984 0.0005650347 0.0002365261 0.0001695104
##  [6] 0.0002712166 0.0001695104 0.0004159764 0.0004334073 0.0003641035
automatically convert units, which also happens in plots (note the converted units symbols):
par(mar = par("mar") + c(0, .3, 0, 0))
plot(1/displacement, 1/consumption)
How to do this with ggplot?
We can of course plot these data by dropping units:
library(ggplot2)
ggplot() + geom_point(aes(x = as.numeric(displacement),
    y = as.numeric(consumption)))

but that doesn’t show us units. Giving the units as variables gives an error:
ggplot() + geom_point(aes(x = displacement, y = consumption))

## Don't know how to automatically pick scale for object of type units. Defaulting to continuous.
## Don't know how to automatically pick scale for object of type units. Defaulting to continuous.

## Error in Ops.units(x, range[1]): both operands of the expression should be "units" objects
 (I could make
that error go away by letting
(I could make
that error go away by letting units drop the requirement that in a
comparison both sides should have compatible units, which of course
would be wrong.)
We can then go all the way with
ggplot() + geom_point(aes(x = as.numeric(displacement),
    y = as.numeric(consumption))) +
    xlab(make_unit_label("displacement", displacement)) +
    ylab(make_unit_label("consumption", consumption))
which at least doesn’t cut off the left label, but feels too convoluted and error-prone.
Oh ggplot gurus, who can help us out, here? How can we obtain that last plot by
ggplot() + geom_point(aes(x = displacement, y = consumption))
?
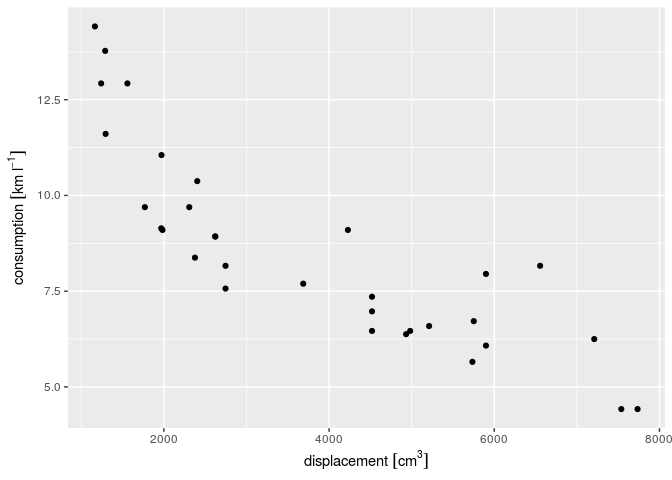
Update of Dec 2, 2016
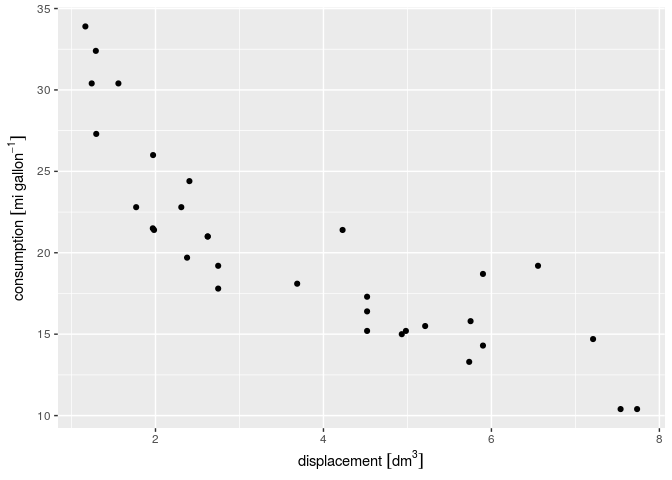
Thanks to ggguru Thomas Lin Pedersen, automatic units in axis labels of ggplots are now provided by CRAN package ggforce:
library(ggforce)
ggplot() + geom_point(aes(x = displacement, y = consumption))

and see this vignette for more examples. In addition to printing units in default axes labels, it allows for on-the-fly unit conversion in ggplot expressions:
dm = with(ud_units, dm)
gallon = with(ud_units, gallon)
mi = with(ud_units, mi)
ggplot() + geom_point(aes(x = displacement, y = consumption)) +
    scale_x_unit(unit = dm^3) + scale_y_unit(unit = mi/gallon)
Related posts/articles
- Does R understand physical quantities?
- Measurement units in R now simplify
- Measurement units for R (R Journal draft manuscript, package vignette)