Fitting variogram models in gstat
Fitting variogram functions with R package gstat has become more flexible, and hopefully more user friendly. Up to now, after loading data
library(sp)
demo(meuse, ask = FALSE, echo = FALSE) # load meuse data set
users were required to use a sequence like
library(gstat)
v = variogram(log(zinc)~1, meuse)
v.fit = fit.variogram(v, vgm(1, "Sph", 900, 1))
v.fit

##   model      psill    range
## 1   Nug 0.05066243   0.0000
## 2   Sph 0.59060780 897.0209
where fit.variogram fits variogram parameters of a spherical model
(Sph) to the sample variogram v. The values 1, 900 and 1 were needed
as initial values in the weighted non-linear fit (where only the range
parameter is non-linear).
This has changed in gstat version 1.2: now, vgm can take only a
variogram model, as in
fit.variogram(v, vgm("Sph"))

##   model      psill    range
## 1   Nug 0.05065971   0.0000
## 2   Sph 0.59060511 897.0011
or even a set of models, in which case the best fitting is returned, as in
fit.variogram(v, vgm(c("Exp", "Sph")))

##   model      psill    range
## 1   Nug 0.05065971   0.0000
## 2   Sph 0.59060511 897.0011

fit.variogram(v, vgm(c("Exp", "Mat", "Sph")))

##   model      psill    range
## 1   Nug 0.05065971   0.0000
## 2   Sph 0.59060511 897.0011
where we still see that the sperical model is chosen. If we choose a different sample variogram, where Matern is chosen, as in:
v0 = variogram(zinc~1, meuse)
fit.variogram(v0, vgm(c("Exp", "Mat", "Sph")))

##   model    psill    range kappa
## 1   Nug   9486.4   0.0000   0.0
## 2   Mat 163285.3 381.7076   0.5
we see that the kappa value is 0.5, which is a default value that was
not fit. We can fit kappa by specifying fit.kappa = TRUE, as in
options(warn = -1) # don't print warnings
fit.variogram(v0, vgm(c("Exp", "Mat", "Sph")), fit.kappa = TRUE)

##   model    psill    range kappa
## 1   Nug      0.0   0.0000   0.0
## 2   Mat 176455.5 456.4375   0.4
where the best fitting kappa from the range 0.3, 0.4, 0.5,…,5 is chosen. I suppressed warnings here, as around 20 warnings were printed in cases with crazy initial values. This is usual for Matern models: larger kappa values have effective ranges (the distance value at which the model reaches, say, 95% of its sill) much larger than the range parameter, as illustrated by
plot(variogramLine(vgm(1, "Mat", 1, kappa = 4), 10), type = 'l')
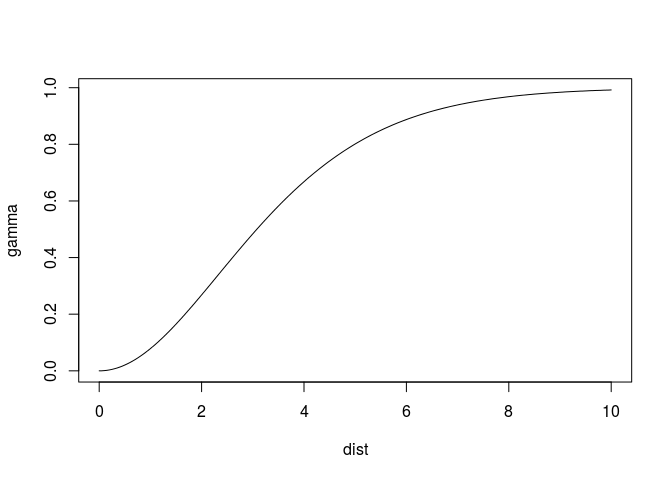
where at distance 1, 0.05 of the sill is reached (and the model, up till there, is nearly linear or parabolic, leading to a singularity during fit). A different parameterisation of the Matern model, given in Michael Stein’s book, is the following
plot(variogramLine(vgm(1, "Ste", 1, kappa = 4), 10), type = 'l')
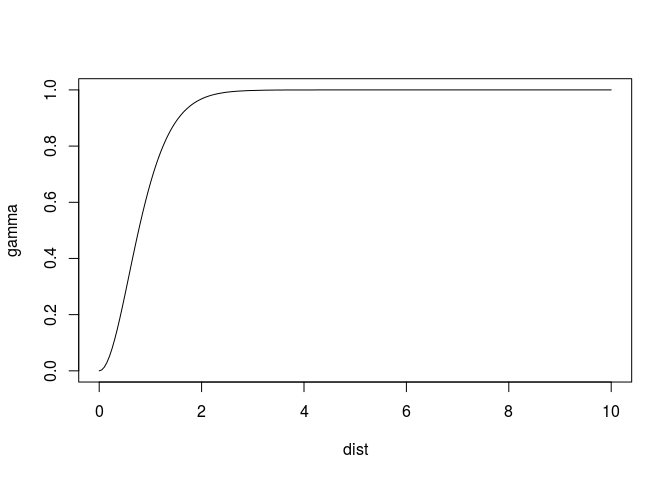
This one has the same smoothness, but reaches the sill much closer to the range value. As a consequence it fits easier, that is, without warnings:
options(warn = 0) # set back to normal
fit.variogram(v0, vgm(c("Exp", "Ste", "Sph")), fit.kappa = TRUE)

##   model    psill    range kappa
## 1   Nug      0.0   0.0000   0.0
## 2   Ste 176455.4 577.3522   0.4
For those you need a more precise estimate of the optimal kappa value, you can iterate over steps of e.g. 0.01 by
fit.variogram(v0, vgm(c("Exp", "Ste", "Sph")), fit.kappa = seq(.3,5,.01))

##   model       psill    range kappa
## 1   Nug    282.7529   0.0000  0.00
## 2   Ste 175030.7434 563.3126  0.41
How it works
Default initial parameter values are chosen from the sample variogram, where:
- the range parameter is taken as 1/3 of the maximum sample variogram distance,
- the nugget parameter is taken as the mean of the first three sample variogram values, and
- the partial sill is taken as the mean of the last five sample variogram values.
vgm("Sph")

##   model psill range
## 1   Nug    NA     0
## 2   Sph    NA    NA
contains NA values for the numeric parameters, and under the hood
(undocumented)
gstat:::vgm_fill_na(vgm("Sph"), v)

##   model     psill    range
## 1   Nug 0.2141508   0.0000
## 2   Sph 0.6200691 514.4008
fills the NA values with the initial values.
Providing more than one model to vgm returns a list,
vgm(c("Sph", "Exp"))

## [[1]]
##   model psill range
## 1   Nug    NA     0
## 2   Sph    NA    NA
##
## [[2]]
##   model psill range
## 1   Nug    NA     0
## 2   Exp    NA    NA
##
## attr(,"class")
## [1] "variogramModelList" "list"
which fit.variogram iterates over, returning the best fitting model.
Comparison to automap
Function automap::autofitVariogram does a similar job, but includes
the computation of the sample variogram from data (which can be
controlled by passing parameters to ...). It takes slightly different
defaults for fitting, definitely different defaults when computing the
sample variogram, and has options for combining distance bins.