Spatial analysis with geostan
- Summary
- Installation
- Getting started
- Adjacency matrix
- Non-spatial regression
- Spatial regression
- Future work and support
- Appendix
- References
Summary
This post introduces the geostan R package for spatial analysis. The package is mainly oriented towards areal data, although some models may also be used for other spatial data types. The package implements the spatial error/simultaneous spatial autoregressive (SAR) model, conditional autoregressive (CAR) model, and eigenvector spatial filter (ESF) models for spatial regression. A version of ESF modelling also appears in the ecology literature as principle coordinate analysis of neighbor matrices (PCNM) (Griffith and Peres-Neto 2006).
geostan also supports the application of the above regression methods
to hierarchical models for count data, as is common in analyses of
disease incidence or mortality in small areas (‘disease mapping’).
Additional features of the software include models for
sampling/measurement error in covariates and methods for handling
censored count data, such as when mortality or disease counts have been
censored for privacy. The models were built using the
Stan modeling language, so all inference is
completed using Markov chain Monte Carlo (MCMC) sampling (Stan
Development Team 2023; Gabry et al. 2024). The spatial autoregressive
models use custom-built Stan functions that speed up MCMC sampling
considerably (Donegan 2021).
This post will walk through an example analysis using international data
on life expectancy and per capita GDP. Package vignettes can be found
with the online
documentation,
including an introduction to spatial weights matrices, exploratory
spatial data analysis, spatial measurement error models, raster
regression, and using geostan to build custom spatial models with Stan.
A paper in the Journal of Open Source
Software reports these and other
features and provides the recommended citation when using geostan
(Donegan 2022).
Installation
geostan is currently on CRAN, although that may not always be the
case. You can also install directly from geostan’s github
repository.
From github
You can install from the package github repository:
if (!require('devtools')) install.packages('devtools')
devtools::install_github("connordonegan/geostan")
If you are using Windows and installing using install_github, you may
need to install Rtools
first. Rtools is not needed when installing from CRAN. You may also
contact the author by e-mail for a pre-compiled version that you can use
without Rtools.
If you are using Mac and installing with install_github then you may
need to install Xcode Command Line Tools first.
From CRAN
Using your R console, you can install from CRAN as follows:
install.packages("geostan")
Getting started
To begin, load the geostan and sf packages into your R environment,
as well as the world data:
library(geostan)
library(sf)
data(world, package = "spData")
The world data contains life expectancy and gross domestic product
(GDP) per capita (presumably measured in current $US) for 161 countries
as of 2014, gathered from the World Bank. The rest of this post is going
to be structured around a bivariate analysis of these variables.
We are going to apply the Robinson map projection for the countries:
world <- st_transform(world, crs = 'ESRI:54030')
At least a couple of the missing values can be filled in using World Bank data, so we will do that:
## https://data.worldbank.org
france <- grep("France", world$name_long)
world$gdpPercap[ france ] <- 43068
world$lifeExp[ france ] <- 82

norway <- grep("Norway", world$name_long)
world$gdpPercap[ norway ] <- 97666
world$lifeExp[ norway ] <- 82.1
And we will also remove Antarctica:
world <- subset(world, name_long != "Antarctica")
Mapping the variables shows the familiar geography of high-, middle-, and low-income countries and a similar geography of longevity:
# store geometry for countries
world_geom <- st_geometry(world)

# show two maps at once, with nice font
ogpar <- par(mfrow = c(2, 1),
             mar = rep(0, 4))

# GDP per capita
pars <- map_pars(world$gdpPercap / 1e3)
plot(world_geom,
     col = pars$col,
     lwd = .2)
legend("bottomleft",
       fill = pars$pal,
       title = 'GDP per capita\n($1,000s)',
       legend = pars$lbls,
       bty = 'n'
)
rm(pars)

# life expectancy
pars <- map_pars(world$lifeExp)
plot(world_geom,
  col = pars$col,
  lwd = .2)
legend("left",
     fill = pars$pal,
     title = 'Life Expectancy',
     legend = pars$lbls,
     bty = 'n'
     )
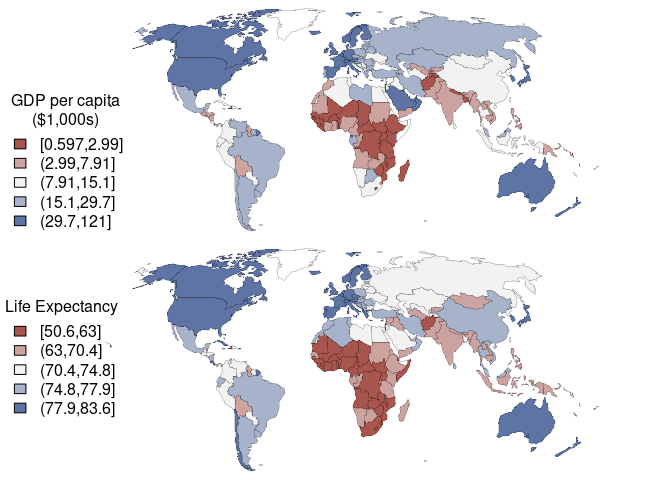
*Choropleth maps of GDP per capita and life expectancy.*
par(ogpar)
The map_pars function breaks the variables into quantiles and returns
breaks, colors, labels for the maps; it can be found at the end of the
post. There will be no discussion of substantive (non-statistical)
issues here, for which one can consult any number of texts on global
power and inequality (e.g., Paul Farmer’s Infections and
Inequalities).
By conventional methods, the correlation coefficient for life expectancy and log GDP per capita is 0.81:
log_x <- log10( world$gdpPercap )
y <- world$lifeExp
cor.test(log_x, y)

##
##  Pearson's product-moment correlation
##
## data:  log_x and y
## t = 17.394, df = 160, p-value < 2.2e-16
## alternative hypothesis: true correlation is not equal to 0
## 95 percent confidence interval:
##  0.7478143 0.8561778
## sample estimates:
##       cor
## 0.8087528
The conventional assessment is based on the proposition that we have 161 independent observations. The visible geography of the variables, and any level of social awareness, indicates that these are not independent observations. Rather, there are various functional regions of countries that share basic political-economic conditions. A lot, but not all, of the variation can be described as variation across continents and regions. We will want to account for this dependence using a spatial model (for background see Chun and Griffith 2012; Donegan 2024). The first step will be to construct a spatial weights matrix.
Adjacency matrix
This section will illustrate use of two geostan functions for creating
an revising a spatial weights matrix: shape2mat and edges. The
shape2mat function may be helpful for some users but one can always do
this using spdep or other methods, especially if shape2mat does not
provide the exact method you’re looking for.
We are going to start by removing the 15 countries that are missing values:
## remove missing values
world <- subset(world, !is.na(gdpPercap) & !is.na(lifeExp))

## leaving 162 observations
nrow(world)

## [1] 162
Now we can apply the shape2mat function to obtain an adjacency
matrix
that encodes spatial adjacency relations for countries into a binary
N-by-N matrix. The function uses spdep to find adjacency relations and
returns results as a sparse matrix (using the Matrix package):
A <- shape2mat(world, "B", method = "rook")

## Contiguity condition: rook

## Number of neighbors per unit, summary:

##    Min. 1st Qu.  Median    Mean 3rd Qu.    Max.
##   0.000   2.000   3.000   3.605   5.000  13.000

##
## Spatial weights, summary:

##    Min. 1st Qu.  Median    Mean 3rd Qu.    Max.
##       1       1       1       1       1       1
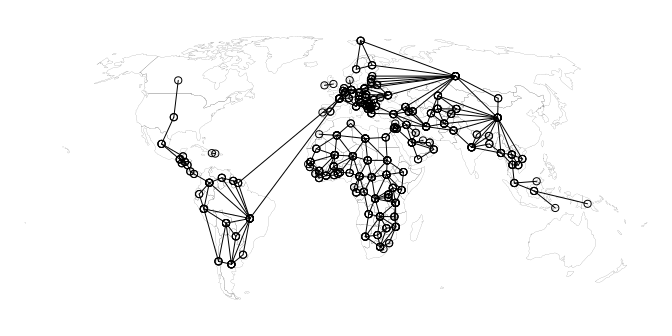
Visualizing the connections in the matrix is important for uncovering
unexpected results. geostan’s edges function converts the matrix
into a list of nodes and edges that we can plot. For this we need to
supply the function with the adjacency matrix, A, and the associated
spatial object, world:
# edges with geometry
E <- edges(A, shape = world)
graph <- st_geometry(E)

ogpar <- par(mar = rep(0, 4))
# plot countries
plot(world_geom, lwd = .1)
# add graph nodes
plot(graph, add = TRUE, type = 'p')
# add graph edges
plot(graph, add = TRUE, type = 'l')
par(ogpar)
This reveals quite a few unexpected results. French Guiana is stored in
the world data as part of France (a multi-part polygon); this is
correct of course but it leads to Brazil and Suriname being listed as
neighbors of France, which is not sensible. Besides removing those
connections, there are a number of island nations that we might want to
connect to nearby places.
To connect Mozambique to Madagascar, we just replace the zeroes with ones in the slots that correspond to those countries. First we grab their index positions in the matrix:
moz_idx <- grep("Mozambique", world$name_long)
mad_idx <- grep("Madagascar", world$name_long)
And then we assign the correct slots in the matrix a value of 1 (or
TRUE), remembering that the adjacency matrix is symmetric:
A[moz_idx, mad_idx] <- A[mad_idx, moz_idx] <- TRUE
This can become tedious but it is important. Before moving on, we will make a series of adjustments. This will be made a bit easier with this convenience function:
connect <- function(country_a, country_b,
    names_vec = world$name_long, matrix = A, add = TRUE) {
  stopifnot( country_a %in% names_vec )
  stopifnot( country_b %in% names_vec )
  a_idx <- which(names_vec == country_a)
  b_idx <- which( names_vec == country_b)
  matrix[a_idx, b_idx] <- matrix[b_idx, a_idx] <- add
  return( matrix )
}
The following are at least reasonable changes to make; they also ensure that every country has at least one neighbor:
A <- connect("Mozambique", "Madagascar")
A <- connect("Australia", "New Zealand")
A <- connect("Philippines", "Malaysia")
A <- connect("Japan", "Republic of Korea")
A <- connect("Fiji", "Vanuatu")
A <- connect("Solomon Islands", "Vanuatu")
A <- connect("Solomon Islands", "Papua New Guinea")
A <- connect("Australia", "Papua New Guinea")
A <- connect("Haiti", "Jamaica")
A <- connect("Bahamas", "United States")
A <- connect("Dominican Republic", "Puerto Rico")
A <- connect("Trinidad and Tobago", "Venezuela")
A <- connect("Sri Lanka", "India")
A <- connect("Cyprus", "Turkey")
A <- connect("Cyprus", "Lebanon")
A <- connect("Norway", "Iceland")

## remove connections between South American and France
A <- connect("Suriname", "France", add = FALSE)
A <- connect("Brazil", "France", add = FALSE)
We should look at the revised adjacency matrix:
graph <- st_geometry( edges(A, shape = world) )
ogpar <- par(mar = rep(0, 4))
plot(world_geom, lwd = .1)
plot(graph, add = TRUE, type = 'p')
plot(graph, add = TRUE, type = 'l')
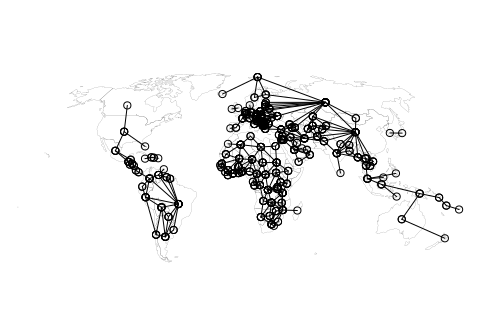
par(ogpar)
Sometimes it can help to examine the edge list interactively using a proper geographic information system like QGIS. For those who are familiar with (non-R) GIS software, you can save the edges list as a GeoPackage and then open it up in your GIS to examine the connections ‘by hand’ with a base map or other data:
E <- edges(A, shape = world)
st_write(E, "world.gpkg", layer = "edge list")
Non-spatial regression
Fitting regression models with geostan is similar to using base R’s
glm function: the user provides a model formula, data, and the model
family or distribution. We can fit a normal linear model using the
stan_glm function:
fit_lm <- stan_glm(lifeExp ~ log(gdpPercap), data = world, quiet = TRUE)
And we can examine parameter estimates by printing to the console:
print(fit_lm)

## Spatial Model Results
## Formula: lifeExp ~ log(gdpPercap)
## Spatial method (outcome):  none
## Likelihood function:  gaussian
## Link function:  identity
## Residual Moran Coefficient:  NA
## WAIC:  977.33
## Observations:  162
## Data models (ME): none
## Inference for Stan model: foundation.
## 4 chains, each with iter=2000; warmup=1000; thin=1;
## post-warmup draws per chain=1000, total post-warmup draws=4000.
##
##                  mean se_mean    sd   2.5%    20%    50%    80%  97.5% n_eff
## intercept      20.660   0.089 2.934 15.106 18.148 20.705 23.117 26.431  1082
## log(gdpPercap)  5.499   0.010 0.317  4.879  5.235  5.498  5.770  6.108  1081
## sigma           4.902   0.007 0.268  4.408  4.676  4.894  5.119  5.468  1458
##                 Rhat
## intercept      1.002
## log(gdpPercap) 1.002
## sigma          1.001
##
## Samples were drawn using NUTS(diag_e) at Thu Aug  1 12:33:33 2024.
## For each parameter, n_eff is a crude measure of effective sample size,
## and Rhat is the potential scale reduction factor on split chains (at
## convergence, Rhat=1).
The output printed to the console provides a summary of the posterior
probability distributions of the model parameters. The distributions can
also be visualized using plot(fit_lm):
plot(fit_lm)

## `stat_bin()` using `bins = 30`. Pick better value with `binwidth`.
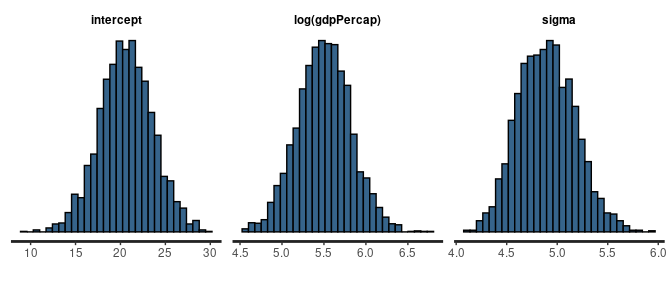
The mean of the distribution is reported in the mean column. For those
who are more familiar with concepts from sampling theory, the mean may
be understood as the estimate of the parameter. Each distribution’s
standard deviation is found in the sd column; this describes the width
of the posterior distribution. The sd is analogous to the standard
error of the estimate. The quantiles also summarize the width of the
posterior distributions; the 2.5% and 97.5% values form a 95% credible
interval for the parameter value.
MCMC output
The effective sample size (ESS), n_eff, tells us how many independent
MCMC samples the inference is based on after adjusting for serial
autocorrelation in the MCMC samples. This is an important quantity to
pay attention to and generally one might like to see these numbers above
400 (or around 100 samples per MCMC chain). The standard error of the
mean, se_mean, reports how much MCMC sampling error to expect in the
mean (se_mean is calculated using n_eff). The R-hat statistic,
Rhat, should always be very close to 1, preferably less than 1.01. The
R-hat diagnostic tests that the MCMC chains are all depicting the same
distribution. If they diverge from one another, it either means that you
need to draw a higher number of MCMC samples (run the chains for longer)
or that there is a problem fitting the model to your data.
By default, geostan models run four independent MCMC chains for 3,000
iterations each, half of which is discarded as warm-up. The number of
iterations is controlled by the iter argument, the default being
iter = 3e3. For some models this may be too low and you will want to
increase this. Other times this might be more than is needed in which
case you can reduce the computation time by using fewer iterations. What
matters most is not your number of iterations but your ESS and R-hat
statistics. When it comes to reporting results, it is generally best to
use at least the default of four MCMC chains (chains = 4).
Methods
A number of familiar methods are available for working with geostan
models including fitted, resid, and predict.
The fitted method returns a data.frame with summaries of the fitted
values. The probability distribution for each fitted value is summarized
by its posterior mean, standard deviation, and quantiles:
fdf <- fitted(fit_lm)
head(fdf)

##               mean        sd     2.5%      20%      50%      80%    97.5%
## fitted[1] 70.22990 0.3969583 69.46571 69.88939 70.23141 70.55628 71.00631
## fitted[2] 63.46359 0.5884022 62.31542 62.98235 63.45552 63.94977 64.64037
## fitted[3] 79.33702 0.6206999 78.07451 78.81257 79.34308 79.86151 80.53088
## fitted[4] 80.36367 0.6675295 79.01816 79.79764 80.37163 80.93076 81.65248
## fitted[5] 76.02492 0.4883834 75.05750 75.61649 76.03594 76.44239 76.95946
## fitted[6] 67.88820 0.4339864 67.04641 67.52555 67.88695 68.24651 68.74736
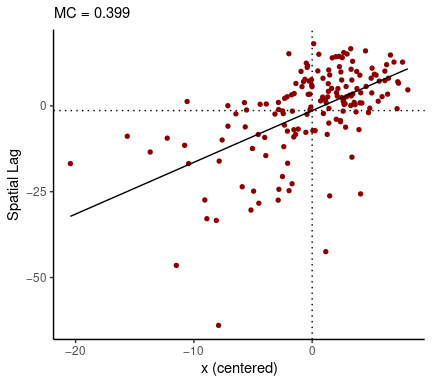
The resid method behaves similarly. Examining the Moran scatter plot
using the residuals shows a moderate degree of positive SA as well as
some skewness:
rdf <- resid(fit_lm)
moran_plot(rdf$mean, A)
Spatial regression
Options for spatial regression models currently include conditional autoregressive (CAR), simultaneous autoregressive (SAR/spatial error), and eigenvector spatial filtering (ESF). For count data, common variations on the intrinsic autoregressive (ICAR) model are also available.
All of the spatial models require at least a spatial weights matrix as
input. All additional requirements for data preparation are handled by
geostan’s prep_ functions: prep_car_data, prep_icar_data,
prep_sar_data.
The make_EV function is used to create Moran’s eigenvectors for ESF
regression; if you want to create your own eigenvectors (say, following
the PCNM method) you can provide those directly to the ESF model (see
?stan_esf).
For the CAR model, we always provide the binary adjacency matrix as
input to prep_car_data. See the prep_car_data documentation for
options. Here we will fit an intercept-only CAR model to the life
expectancy data:
cars <- prep_car_data(A)
fit_car <- stan_car(lifeExp ~ 1, data = world, car_parts = cars, iter = 1e3, quiet = TRUE)

print(fit_car)

## Spatial Model Results
## Formula: lifeExp ~ 1
## Spatial method (outcome):  CAR
## Likelihood function:  auto_gaussian
## Link function:  identity
## Residual Moran Coefficient:  -0.356467
## WAIC:  994.65
## Observations:  162
## Data models (ME): none
## Inference for Stan model: foundation.
## 4 chains, each with iter=1000; warmup=500; thin=1;
## post-warmup draws per chain=500, total post-warmup draws=2000.
##
##             mean se_mean    sd   2.5%    20%    50%    80%  97.5% n_eff  Rhat
## intercept 70.261   0.081 2.664 65.007 68.274 70.280 72.325 76.104  1080 1.002
## car_rho    0.981   0.000 0.010  0.958  0.973  0.983  0.990  0.996  1245 1.003
## car_scale  7.827   0.011 0.449  7.000  7.441  7.806  8.202  8.761  1564 1.001
##
## Samples were drawn using NUTS(diag_e) at Thu Aug  1 12:33:38 2024.
## For each parameter, n_eff is a crude measure of effective sample size,
## and Rhat is the potential scale reduction factor on split chains (at
## convergence, Rhat=1).
Notice that using iter = 1000 was more than adequate for inference in
this case.
The CAR model has a spatial dependence parameter car_rho. This
parameter does not have an interpretation similar to a correlation
coefficient, and it is often near 1; this is not a problem unless one
misinterprets it or desires a value similar to the correlation
coefficient. The spatial dependence parameter in the SAR model does
provide that kind of interpretation.
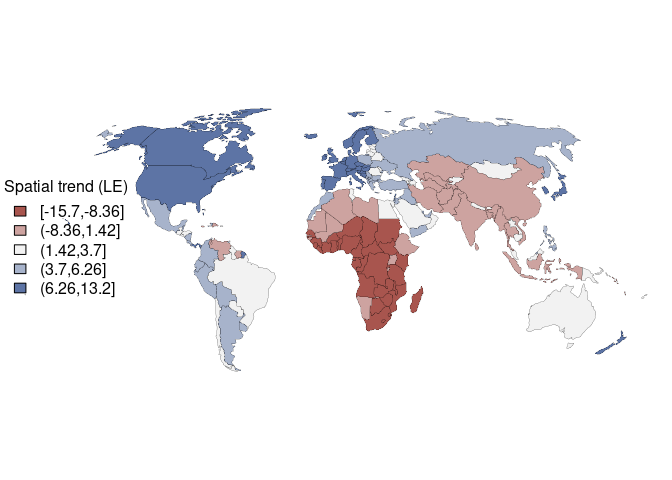
A filtering approach
Returning to the correlation coefficient estimated above, one way to adjust our estimate for spatial dependence is to filter out the spatial trend from each of the two variables and then calculate the correlation coefficient using the detrended values (Chun and Griffith 2012, 71). This spatial ‘filtering’ or ‘pre-whitening’ method is not particularly common in practice but its a good trick to know given the familiarity of the correlation coefficient. We will use it here to demonstrate some basic features of the software.
The spatial trend term can be extracted from any spatial geostan model
using the spatial method.
theta <- spatial(fit_car)$mean

pars <- map_pars(theta)
ogpar <- par(mar = rep(0, 4))
plot(st_geometry(world),
  col = pars$col,
  lwd = .2)
legend("left",
     fill = pars$pal,
     title = 'Spatial trend (LE)',
     legend = pars$lbls,
     bty = 'n'
     )
par(ogpar)
We can obtain detrended values most simply by taking the residuals from an intercept-only spatial model:
# lifeExpt detrended
dy <- resid(fit_car)$mean

# log per capita GDP detrended
fit_carx <- stan_car(log(gdpPercap) ~ 1, data = world, car = cars, iter = 1e3, quiet = TRUE)
dx <- resid(fit_carx)$mean
Using cor.test with those provides an estimate of correlation adjusted
for spatial autocorrelation:
# adjusted correlation
cor.test(dx, dy)

##
##  Pearson's product-moment correlation
##
## data:  dx and dy
## t = 9.1418, df = 160, p-value = 2.666e-16
## alternative hypothesis: true correlation is not equal to 0
## 95 percent confidence interval:
##  0.4744113 0.6786559
## sample estimates:
##       cor
## 0.5857574
The adjusted estimate of .59 is considerably different from the naive estimate of .80 and is outside the naive confidence intervals. (The adjusted estimate is .62 if we use SAR models.)
A bivariate model
Here we will use the SAR model to illustrate its use. Fitting the spatial error or SAR model requires nearly the same steps as above.
Unlike prep_car_data, be sure to row-standardize the adjacency matrix
before passing it to prep_sar_data.
W <- row_standardize(A)
sars <- prep_sar_data(W)
When fitting the model, we are going to add centerx = TRUE to center
the covariate. (Internally this will call
center(x, center = TRUE, scale = FALSE).) This will not change
coefficient estimates but it does often improve MCMC sampling
efficiency, sometimes considerably so. It does change interpretation of
the intercept: the intercept will be an estimate of the average life
expectancy (or the expected life expectancy when all covariates are at
their average values).
fit_sar <- stan_sar(lifeExp ~ log(gdpPercap), data = world, sar_parts = sars, centerx = TRUE,
                    iter = 1e3, quiet = TRUE)
Lets plot the results this time:
plot(fit_sar)

## `stat_bin()` using `bins = 30`. Pick better value with `binwidth`.
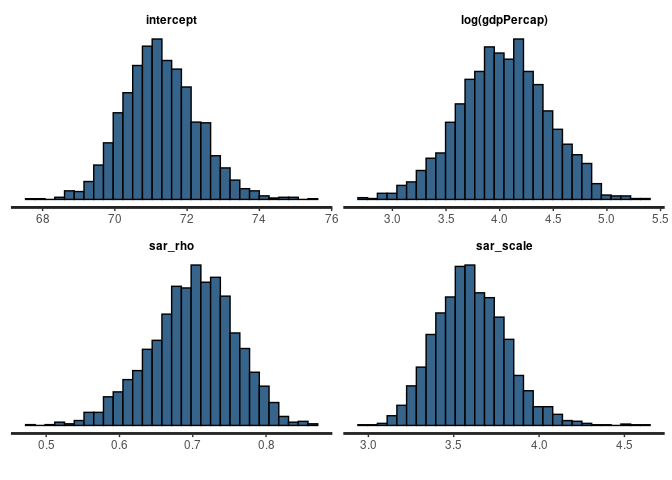
The spatial dependence parameter is around 0.7, which indicates moderately strong SA. The mean life expectancy is about 71 (probably somewhere between about 69 and 74). And the coefficient for log GDP is around 4 (or somewhere between 3 and 5). The residual variation has a standard deviation of around 3.6 years.
If we scale both variables before fitting the bivariate spatial regression model (so that their variances both equal 1) then we get approximately the same estimate as the adjusted correlation coefficient (above). The credible interval is slightly wider because uncertainty in rho is (appropriately) incorporated here:
world <- transform(world,
                  sx = scale(log(gdpPercap), scale = T, center = T),
                  sy = scale(lifeExp, scale = T, center = T)
                   )

fit_scaled <- stan_sar(sy ~ sx, data = world, sar_parts = sars, iter = 1e3, quiet = TRUE)
print(fit_scaled)

## Spatial Model Results
## Formula: sy ~ sx
## Spatial method (outcome):  SAR
## Likelihood function:  auto_gaussian
## Link function:  identity
## Residual Moran Coefficient:  -0.0555795
## WAIC:  224.16
## Observations:  162
## Data models (ME): none
## Inference for Stan model: foundation.
## 4 chains, each with iter=1000; warmup=500; thin=1;
## post-warmup draws per chain=500, total post-warmup draws=2000.
##
##            mean se_mean    sd   2.5%    20%   50%   80% 97.5% n_eff  Rhat
## intercept 0.017   0.003 0.121 -0.213 -0.081 0.015 0.110 0.259  1374 1.001
## sx        0.584   0.002 0.062  0.462  0.533 0.586 0.636 0.706  1550 1.001
## sar_rho   0.703   0.002 0.057  0.577  0.656 0.708 0.753 0.801  1224 1.000
## sar_scale 0.438   0.001 0.027  0.391  0.415 0.436 0.461 0.496  1541 1.000
##
## Samples were drawn using NUTS(diag_e) at Thu Aug  1 12:33:49 2024.
## For each parameter, n_eff is a crude measure of effective sample size,
## and Rhat is the potential scale reduction factor on split chains (at
## convergence, Rhat=1).
Predicted values
We can visualize the model results by plotting the expected life
expectancy across the full range of GDP per capita. We use the predict
function for this. As input, it requires our fitted model and a
data.frame with covariate values.
We will start by creating a data.frame with GDP per capita values that
span from the minimum to maximum values in the world data:
gdp <- range(world$gdpPercap)
min_gdp <- gdp[1]
max_gdp <- gdp[2]
pdf <- data.frame(gdpPercap = seq(min_gdp, max_gdp, length.out = 200))
The column names in this data.frame have to match the variable names
that were present in the data that we first provided to the model. In
this case, the name of the columns should match those from the world
data. Likewise, we provide the new GDP data on its original
(un-transformed) scale, just as we did when we fit the model using
stan_sar (the log transformation will be applied by predict because
it is specified in the model formula). Because we centered the covariate
using the centerx = TRUE argument, we will also allow the predict
function to handle the centering automatically using information that is
stored with the fitted model (stan_sar$x_center).
Now we pass this new data to predict:
preds <- predict(fit_sar, newdata = pdf)
The output includes our pdf data plus some new columns. The new
columns provide a summary of the predicted values. As usual, the mean
is the estimate and the estimate is accompanied by other values that can
be used to taken as credible intervals for the predicted value. The
output reflects uncertainty in the model parameter estimates.
head(preds)

##   gdpPercap     mean       sd     2.5%      20%      50%      80%    97.5%
## 1  597.1352 60.10281 1.525231 57.31512 58.81438 60.02981 61.40785 63.23217
## 2 1201.4715 62.90912 1.324012 60.47457 61.78458 62.84984 64.02423 65.60880
## 3 1805.8079 64.54460 1.222436 62.29812 63.50132 64.50656 65.56321 67.07337
## 4 2410.1442 65.70331 1.159626 63.56161 64.71873 65.67025 66.65184 68.13579
## 5 3014.4805 66.60137 1.117121 64.51219 65.64677 66.57454 67.52918 68.94410
## 6 3618.8169 67.33477 1.086904 65.28404 66.40366 67.29468 68.21982 69.56564
These ‘predicted’ values represent the expectation of the outcome
variable at the given level of the covariates. So we would expect actual
observations to form a cloud of points around the ‘predicted’ values. To
calculate these predicted values, the predict function only includes
covariates and the intercept, it does not include any spatial
autocorrelation components. Its purpose is to examine implications of
the coefficient estimates on recognizable scales of variation, not to
predict values for particular places. (The log-linear model can also be
interpreted in terms of percent changes in the covariate, such as ’a 10%
increase in GDP per capita, e.g., from 10,000 to 11,000, is associated
with around 4 * log(11/10) = 0.38 additional years of life expectancy
on average.)
# scale GDP
preds <- transform(preds, gdpPercap = gdpPercap / 1e3)

yrange <- c(min(preds$`2.5%`), max(preds$`97.5%`))
plot(preds$gdpPercap, preds$mean,
     t = 'l',
     ylim = yrange,
     axes = F,
     xlab = "GDP per capita ($1,000s)",
     ylab = "Life expectancy")
axis(1)
axis(2)

# add credible intervals
lines(preds$gdpPercap, preds$`2.5%`, lty = 3)
lines(preds$gdpPercap, preds$`97.5%`, lty = 3)
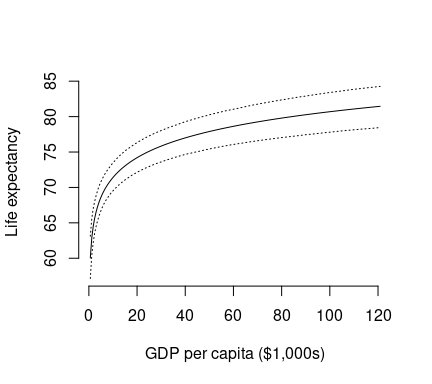
Per this dataset, about 50% of the world population lives in countries with GDP per capita below $12,300.
Future work and support
You can submit any questions, requests, or issues on the package issues
page or the
discussions
page. geostan
is still actively being developed so users are encouraged to check the
package news page for
updates.
If you are interesting contributing to the package you are encouraged to
send an e-mail to the author or use the discussions page. You can submit
a pull request with any bug fixes. Contributions that would make the
package more useful to fields other than geostan’s current focus
(human geography and public health), such as ecology, would be
especially welcome.
Appendix
# function for getting colors, breaks, and labels for mapping
map_pars <- function(x,
                     brks = quantile(x, probs = seq(0, 1, by = 0.2), na.rm = TRUE),
                     cols = c("#A8554EFF", "gray95", "#5D74A5FF")) {

  # put x values into bins
  x_cut <- cut(x, breaks = brks, include.lowest = TRUE)

  # labels for each bin
  lbls <- levels( cut(x, brks, include.lowest = TRUE) )

  # colors
  rank <- as.numeric( x_cut )
  max_rank <- max( rank , na.rm = TRUE )
  pal_fun <- colorRampPalette( cols )
  pal <- pal_fun( max_rank )
  colors <-  pal[ rank ]

  # return list
  ls <- list(brks = brks, lbls = lbls, pal = pal, col = colors)
  return( ls )
}
References
Chun, Yongwan, and Daniel A Griffith. 2012. “Spatial Statistics and Geostatistics: Theory and Applications for Geographic Information Science and Technology.”
Donegan, Connor. 2021. “Building Spatial Conditional Autoregressive (CAR) Models in the Stan Programming Language.” https://osf.io/3ey65/.
———. 2022. “Geostan: An R Package for Bayesian Spatial Analysis.” Journal of Open Source Software 7 (79): 4716. https://doi.org/10.21105/joss.04716.
———. 2024. “Plausible Reasoning and Spatial-Statistical Theory: A Critique of Recent Writings on ‘Spatial Confounding’.” Geographical Analysis Early view. https://doi.org/10.1111/gean.12408.
Gabry, Jonah, Ben Goodrich, Martin Lysy, and Andrew Johnson. 2024. Rstantools: Tools for Developing R Packages Interfacing with ’Stan’. https://CRAN.R-project.org/package=rstantools.
Griffith, Daniel A, and Pedro R Peres-Neto. 2006. “Spatial Modeling in Ecology: The Flexibility of Eigenfunction Spatial Analyses.” Ecology 87 (10): 2603–13.
Stan Development Team. 2023. Stan User’s Guide. https://mc-stan.org.